Download
1 / 18
180 likes | 347 Views
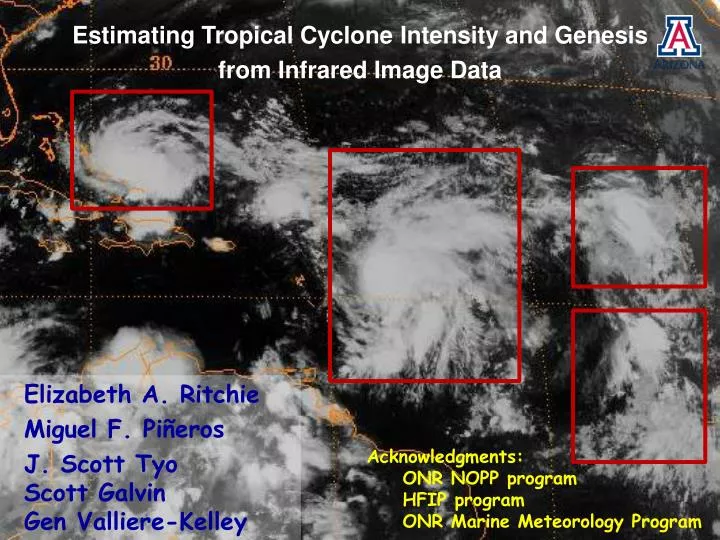
Estimating Tropical Cyclone Intensity and Genesis from Infrared Image Data. Elizabeth A. Ritchie Miguel F. Piñeros J . Scott Tyo Scott Galvin Gen Valliere -Kelley. Acknowledgments: ONR NOPP program HFIP program ONR Marine Meteorology Program. 2. Data.

E N D
Estimating Tropical Cyclone Intensity and Genesis • from Infrared Image Data Elizabeth A. Ritchie Miguel F. Piñeros J. Scott Tyo Scott Galvin Gen Valliere-Kelley Acknowledgments: ONR NOPP program HFIP program ONR Marine Meteorology Program
2. Data Atlantic and Gulf of Mexico: Infrared Imagery (GOES-E) • 2004-2010 • Spatial resolution: 5 km/pixel • Temporal resolution: 30 min • 10.7 μm • remove overland samples and cases outside the analysis region. Use the Deviation-Angle Variance (DAV) Techniqueto extract the genesis and intensity estimation signal
3. Methodology Artificial Hurricane BT gradient field Variance = 0 deg2 Map the DAV back to the reference pixel
3. Methodology Choose a different reference pixel and calculate the DAV
3. Map of Variances Hurricane Wilma (October 2005) • 14 - 00UTC15 – 00UTC 15 - 1345UTC 16 – 00UTC 25kt 17 – 00UTC 30kt 17 – 06UTC 35kt • 18 – 00UTC 55kt19 - 00UTC 130kt20 - 00UTC 135kt 21 - 00UTC 130kt 22 - 00UTC 120kt Extract the minimum value – constrained by the cloud mass
3. DAV time series • Genesis • Intensity Correlation: - 0.93 • 34 kt • NHC first best-track input Hurricane Wilma 2005
3. DAV time series • Genesis • Intensity Correlation: - 0.93 • Low points in the DAV signal Intensity: Map DAV values to BT intensities for all cases 2004-2009 → training set (36TS 42H) Genesis: Accumulate statistics on cloud cluster positive detection versus false alarms for thresholds of DAV (every 50 deg2) 2004-2005 → training set (3TD 1ST 17TS 20H 134NDCC) • NHC first best-track input • 34 kt
4. DAV Intensity estimation Fit is a sigmoid constrained at both ends Training: 2004-2009 Two tests: 1. Train using 2004-2008. Test with 2009 (8 cases) 2. Train using 2004-2009. Test with 2010 (14 cases)
4. DAV Intensity estimation Fit is a sigmoid constrained at both ends Training: 2004-2009 Two tests: 1. Train using 2004-2008. Test with 2009 RSME = 24.8 kt (8 cases) 2. Train using 2004-2009. Test with 2010 RSME = 13.8 kt (14 cases)
4. DAV Intensity estimation Training 2004-2008 Testing 2009: RMSE = 24.8kt !!
4. DAV Intensity estimation Training 2004-2008 Testing 2009: RMSE = 24.8kt !! Remove these 2 cases: RMSE = 12.9 kt!! ** Over-estimate of sheared systems with very circular, offset CDOs Erika
5. Laundry list 1. Fix “shear issue”: constrain the DAV value using operational center fixes: 2010 test: RMSE= 13.04 kt. 2. Fit only to periods when USAF recon is available 3. Other Basins: processing ePac (UA) and wPac (NRL): (in progress) 4. Low wind speeds: limited BT intensity estimates: - use mesoscale model to build simulated “best track” archive (in progress) - query USAF recon database for low wind speed observations and “fit” to those 5. Put “confidence” on estimates: - bin by “cloud scene type” - bin by intensity intervals - bin by environmental conditions
6. DAV Genesis Prediction • Genesis • Intensity • Low points in the DAV signal • NHC first best-track input Genesis: Accumulate statistics on cloud cluster positive detection versus false alarms for thresholds of DAV (every 50 deg2) 2004-2005 → training set (3TD 1ST 17TS 20H 134NDCC)
6. DAV Genesis Prediction ROC curve for IR imagery (2004-2005) 1650 2000 1900 1850 1700 1950 1800 1750 1600 1550 Variance Thresholds 1500 True Positive Rate 1400/1450 1350 False Alarm Rate
6. DAV Genesis Prediction TPR = 93% FAR = 22% TPR = 96% FAR = 40% Time [h] Mean = -0.6 h Mean = -12 h Variance Threshold [deg2] Bottom Line: * Right now can make a deterministic “Yes/No” prediction * Turning into a “probability of TD in 24-, 48-, and 72-h” prediction * Developed a user interface GUI that automatically tracks and labels with DAV thresholds when they are met.
7. Summary • ● A completely objective and independent technique to • estimate TC intensity andpredict genesis. • ● Currently uses only IR 10.7 μm channel • ● Intensity: testing gives results between RMSE 13-14 kt • ● Intensity: gave the laundry list of future development • - also to test 3.9, 6.7, 12 μm channels and polar-orbiting MW • channels – presents its own unique challenge • ● Genesis: there is also a laundry list. • - developing for ePac and wPac • - have already tested 6.7 water vaporμmchannel and not found • new/additionalinformation to improve FAR and “time to detection” • - plan to test 3.9, 12 μmchannels and MW channels
Thank you Piñeros, M. F., E. A. Ritchie, and J. S. Tyo 2008: Objective measures of tropical cyclone structure and intensity change from remotely-sensed infrared image data. IEEE Trans. Geosciences and remote sensing.46, 3574-3580. Piñeros, M. F., E. A. Ritchie, and J. S. Tyo 2010: Detecting tropical cyclone genesis from remotely-sensed infrared image data. IEEE Trans. Geosciences and Remote SensingLetters, 7, 826-830. Piñeros, M. F., E. A. Ritchie, and J. S. Tyo 2011: Estimating tropical cyclone intensity from infrared image data. Wea. Forecasting, (In review). Valliere-Kelley, G., E. A. Ritchie, M. F. Pineros, and J. S. Tyo: Tropical cyclone intensity estimates using the Deviation-Angle Variance Technique: Part I. Statistics for the 2009-2011 seasons based on intensity bins. Wea. And Forecasting, (In Preparation).
4. DAV Intensity estimation Training 2004-2009 Testing 2010: RMSE = 13.8kt !!