Download
1 / 13
130 likes | 588 Views
Acoustics. (Activity of ITEP group). V.I. Albul 1) , V.B. Bychkov 1) , V.S. Demidov 2) , E.V. Demidova 2) , K.E. Gusev 2) , N.K.Krasnov 1) , A.F. Kurchanov 1) , V.E. Lukyashin 2) , V.I. Lyashuk 2) , E.G. Novikov 2) ,

E N D
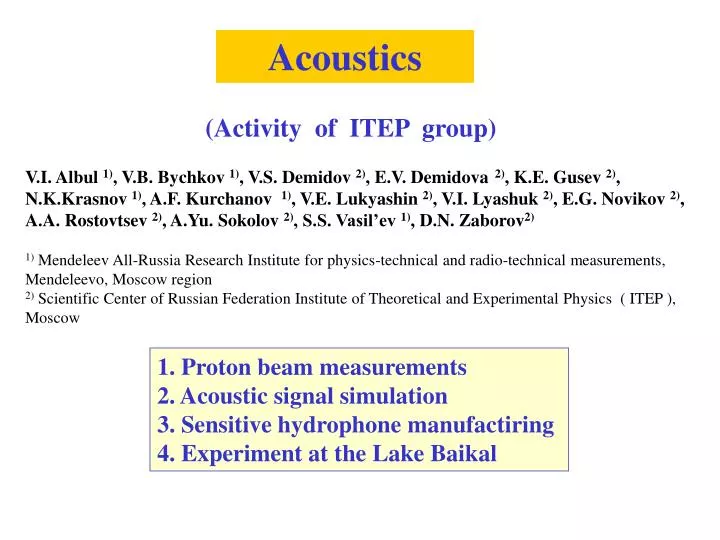
Acoustics (Activity of ITEP group) V.I. Albul 1), V.B. Bychkov 1), V.S. Demidov 2), E.V. Demidova 2), K.E. Gusev 2), N.K.Krasnov 1), A.F. Kurchanov 1), V.E. Lukyashin 2), V.I. Lyashuk 2), E.G. Novikov2), A.A. Rostovtsev2), A.Yu. Sokolov2), S.S. Vasil’ev 1), D.N. Zaborov2) 1) Mendeleev All-Russia Research Institute for physics-technical and radio-technical measurements, Mendeleevo, Moscow region 2) Scientific Center of Russian Federation Institute of Theoretical and Experimental Physics ( ITEP ), Moscow 1. Proton beam measurements 2. Acoustic signal simulation 3. Sensitive hydrophone manufactiring 4. Experiment at the Lake Baikal
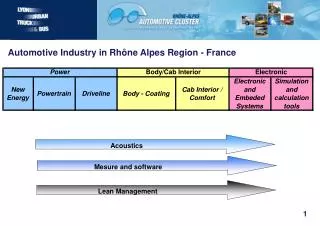
Two experiments with proton beam at ITEP Proton beam: 200 MeV / ~70 ns / 108 – 1012 protons / Diam = 1-5 cm • Measurement of the signal • shape and propagation inside the • water volume. II. Measurement of a tempera- ture dependence of the acoustic signal formation. P P
Propagation of the acoustic signal Proton beam Time [mks] A structure of the acoustic field as measured by a movable hydrophone synchronized with the proton beam. Sound sources A: acoustic trace from the absorbed beam B-D: acoustic signal from the Bregg peak A-C: acoustic signal from beam entry point These 3 sound sources define a structure of the recorded signals.
Measurement of the temperature dependence The temperature was varied between about 1o C and 8o C At T~4oC the acoustic signals change polarity and get broader Amplitude ~4oC
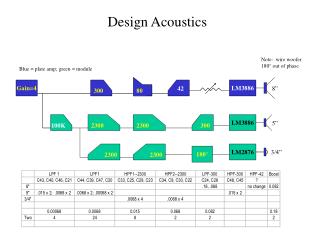
Simulation of an acoustic signal calculations energy deposition in water E = 3.2 E+17ev, distance 0.32m (compared to the model of G.A.Askarian ) The model underestimates the ITEP proton beam measurements by factor of 2
Deep water hydrophones ( ITEP, Moscow), used for searching of signals from extensive atmospheric showers and acoustic investigations in the experiment BAIKAL during expeditions of 2001 - 2003 years
Scheme of the acoustic experiment lake Baikal March, 23 – April, 4 2003 Scintillator detectors (EAS trigger) 50 m 30 m 50 m H1 (4 m) B4 (4 m) B3 (4 m) G8 (9 m) G7 (9 m) B6 (4 m) H2 (9 m) H3 (14 m) H4 (19 m) hydrophones (name and depth shown)
Hydroacoustic antenne of ITEP (Moscow), used for searching of signals from extensive atmospheric showers in the experiment BAIKAL
An example of detected sound (hydrophones H1-H4,G7,G8) Arbitrary units
An example of detected sound (hydrophones B4,B6,B3) Arbitrary units * This example presents a background signal (not a signal from EAS)
Distribution of the delays in the triangle of hydrophones located on a horizontal plane (H2-G7-G8) The ellipse corresponds to real physical sounds located near horizontal plane φ Sounds coming from or through the center of the experimental setup
Angular distribution of sources seen from H2, calculated from arrival times of signals at (H2-G7-G8) sin 3 “clusters” = 90º surface noise = 0º ??? = -10º ??? noise channeling below ice due to temperature gradient ? t8-t2 = ((d8-d2)/v)*cos *cos ( s- 82) t7-t2 = ((d7-d2)/v)*cos *cos ( s- 72)