Download
1 / 28
280 likes | 432 Views
Update on the occupancy based assessment of regional population status and vulnerability for three species of fish in Utah: A template for assessing extinction risk and prioritizing conservation actions. Phaedra Budy Mary Conner Nira Salant Wally MacFarlane Utah Chapter – AFS

E N D
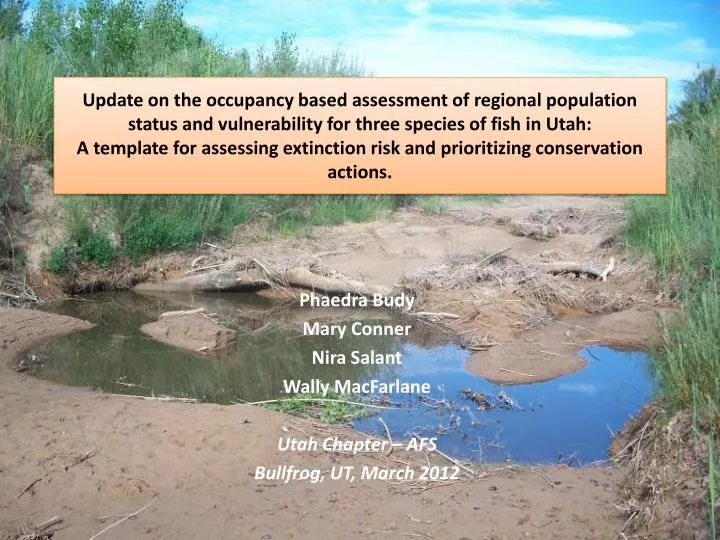
Update on the occupancy based assessment of regional population status and vulnerability for three species of fish in Utah: A template for assessing extinction risk and prioritizing conservation actions. Phaedra Budy Mary Conner NiraSalant Wally MacFarlane Utah Chapter – AFS Bullfrog, UT, March 2012
Anthropogenic Alterations Natural Flow Regime Habitat Native Fishes Invasive Fishes Food Availability
Managed as an ecological complex Range-wide conservation agreement Charisma?
Objectives Build a series of occupancy and extinction risk models for the three species in Utah in order to: • 1) identify statewide and and regional trends in occupancy, trend, and extinction • 2) Identify influential factors on 1) above • 3) identify spatial areas of greater or lesser risk • 4) determine the suitability of managing the three species as a complex
Methods • Contemporary time period to start • 2001- present • Regional Biologists assembled available data: • Present, Absent, not sampled • Site: • ~~a river, or reach of a river where the population likely acts as a sub-population • e.g., above or below a major barrier to most movement • or a primary, repeated sample unit (e.g., Green R.) • Quantified potential hydrologic and temperature variables
Potential Covariates Variables likely to influence pattern of occupancy • Hydrologic variables: • MAQ: mean annual discharge • PAQ: peak annual discharge • STDAQ: standard deviation of MAQ • Temperature • Mean summer temperature • Data were very limited • Exotic fishes: • Present/Absent
Fit a series of occupancy models: • Best fitting –model selection criteria (dAIC) • Response variables: • Proportion of sites occupied (ψ) • Local colonization rate (ϒ) • Local extinction rate (ε) • Site occupancy growth rate (λ;-/+) • p. of detection (p)
p. of site occupancy (ψ):~~proportion of sites occupied ~~0.75 time ??
p. of colonization (γ):being unoccupied in t1 and occupied in t2 time
p. of extinction (ε):being occupied in t1 and unoccupied in t2 time
site occupancy trend (λ):rate that sites are being lost or gained time step - series
Primary Questions: contemporary time period • What is the current trend(s) state-wide for each of the 3 spp? • Which covariates appear most influential in explaining the trend(s) statewide? • What is the regional trend for each of the 3 spp? • Do the 3 spp. trend together? • I.e., should they be managed as a complex?
Sample size and rate BHS = 141 FMS = 116 RTC = 116 Total = 373 • Generally low (< 10%) • Worse by region and species (“best” for BHS) • 2008-2009 high years
Top performing models no group (species) • Top model includes: • 3 species as separate groups • region and meanpeakQ as covariates on colonization (and extinction) • species specific and annual differences in probability of capture
p. of detection • RTC are distinct • Detection is high for sampled sites • (but few sampled)
p. of colonization & extinction time • Confidence intervals are large BUT • FMS and BHS: : p. of colonization > p. extinction • RTC: p. of extinction > p. of colonization
Regional trends in site occupancy growth rate (λ) Losing 3% of sites per year Functionally extinct by 2040
Primary Questions (contemporary)? • What is the current trend(s) state-wide for each of the 3 spp? • FMS > BHS • Colonization rates are low, but > extinction rates • Stable? (noting VERY LOW sample rate) • RTC • Distribution is declining rapidly, “extinct” = 2040? • Which covariates appear most influential in explaining the trend(s) statewide? • Discharge, magnitude and variability! • Colonization rates • Exotics likely very influential but (Yes/No present) variable doesn’t work • Almost all sites have at least one exotic present • Can we do better?
Primary Questions (contemporary) • What is the regional trend for each of the 3 spp? • Strong regional signal • BUT only possible for two regions • SR > NER (likely 2 best?) • Do the 3 spp. trend together? (i.e., should they be managed as a complex?) • BHS and FMS trend and occupy sites together • Roundtail chub are different and may need to be managed separately
Additional Conclusions & Implications • Current sampling ‘strategy’ is ineffectual: • many data cannot be used (need repeat at site) • may need to consider a more targeted sampling strategy • at fewer sites • more repeat visits • historical analysis can guide?
Future & Feedback • All historical data (~1900) • River, year • Lose df • GIS layers: • Land use/ownership • Water regulation • Elevation, geology etc. • ?? • Hydrologic variables: • Frequency of 2-year, 10-year floods • Pre-post regulation • Temperature • Exotics: • H,M,L? • Density or CPUE? • Try a better regional category than UDWR region • Major watersheds? 3 spp. database Bezzerides & Bestgen 2002
Acknowledgments • Co-Authors • Kevin McAbee – USFWS • Utah Three Species Group • UDWR Biologists: • Sarra Jones • Paul Thompson • Matt Breen • Dan Keller • Robert Dobbs • U.S. Geological Survey – UCFWRU (in-kind)