Download
1 / 134
1.35k likes | 1.53k Views
($4, 30 units). $4. ($3, 45 units). $3. PRICE. ($2, 60 units). $2. ($1, 75 units). $1. D 1. 15. 45. 60. 0. 30. 75. QUANTITY. Decrease in Demand. ($4, 30 units). ($4, 30 units). $4. ($4, 15 units). ($4, 15 units). ($3, 45 units). ($3, 45 units). $3. ($3, 30 units).

E N D
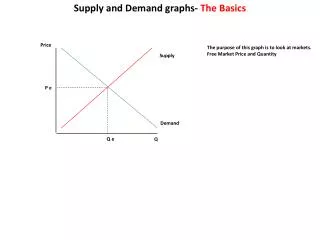
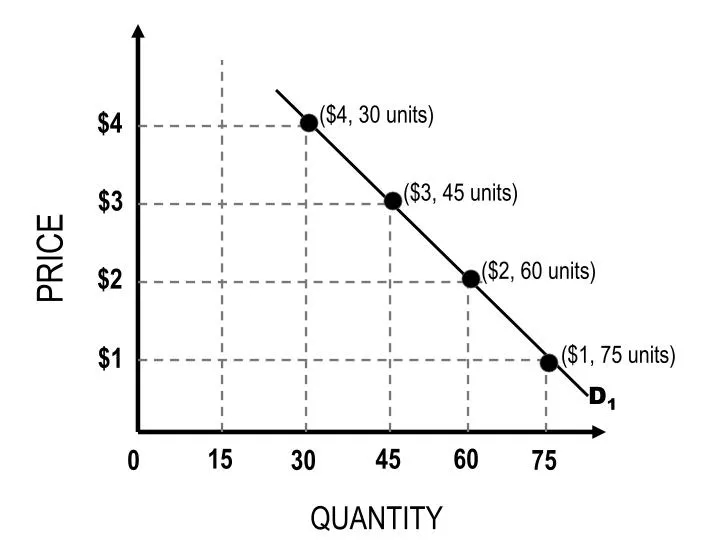
($4, 30 units) $4 ($3, 45 units) $3 PRICE ($2, 60 units) $2 ($1, 75 units) $1 D1 15 45 60 0 30 75 QUANTITY
Decrease in Demand ($4, 30 units) ($4, 30 units) $4 ($4, 15 units) ($4, 15 units) ($3, 45 units) ($3, 45 units) $3 ($3, 30 units) ($3, 30 units) PRICE ($2, 60 units) ($2, 60 units) $2 ($2, 45 units) ($2, 45 units) ($1, 75 units) ($1, 75 units) $1 ($1, 60 units) ($1, 60 units) D2 D1 15 45 60 0 30 75 QUANTITY
($4, 30 units) $4 ($3, 45 units) $3 PRICE ($2, 60 units) $2 ($1, 75 units) $1 D1 15 45 60 0 30 75 QUANTITY
Increase in Demand ($4, 15 units) ($4, 15 units) $4 ($4, 30 units) ($4, 30 units) ($3, 30 units) ($3, 30 units) $3 ($3, 45 units) ($3, 45 units) PRICE ($2, 45 units) $2 ($2, 45 units) ($2, 60 units) ($2, 60 units) ($1, 60 units) ($1, 60 units) $1 ($1, 75 units) ($1, 75 units) D1 D2 15 45 60 0 30 75 QUANTITY
$4 $3 PRICE $2 $1 D1 D2 15 45 60 0 30 75 QUANTITY
$4 $3 PRICE $2 $1 D2 D1 15 45 60 0 30 75 QUANTITY
S1 S2 $4 $3 PRICE $2 $1 15 45 60 0 30 75 QUANTITY
S2 S1 $4 $3 PRICE $2 $1 15 45 60 0 30 75 QUANTITY
S1 $4 $3 E1 PRICE $2 $1 D1 15 45 60 0 30 75 QUANTITY
S1 $4 $3 E1 QD=QS PRICE $2 QS QD $1 Decrease in Price SHORTAGE D1 15 45 60 0 30 75 QUANTITY
S1 Increase in Price SURPLUS $4 QD QS $3 E1 QD=QS PRICE $2 $1 D1 15 45 60 0 30 75 QUANTITY
S1 Increase in Price SURPLUS $4 QD QS $3 E1 QD=QS PRICE $2 QS QD $1 Decrease in Price SHORTAGE D1 15 45 60 0 30 75 QUANTITY
S1 E1 PRICE D1 0 QUANTITY
PRICE 0 QUANTITY
AS1 E2 P2 PRICE LEVELS E1 P1 AD2 AD1 0 Q1 fe Q2 REAL GDP
LRAS1 LRAS1 AS1 PL1 AD1 0 fe fe Y1 Y2 REAL GDP
AS1 E1 PL1 PRICE LEVELS AD1 0 fe Y1 REAL GDP
AS1 E1 PL1 PRICE LEVELS AD1 0 fe Y1 REAL GDP
AS1 PL1 E1 PL2 E2 PRICE LEVELS AD1 AD2 0 Y2 Y1 fe REAL GDP
LRAS1 AS1 PL1 E1 PRICE LEVELS AD1 0 fe Y1 REAL GDP
LRAS1 AS2 AS1 PL2 E2 PL1 E1 AD1 0 fe Y2 Y1 REAL GDP
SLF SLF IR2 IR1 DLF 0 Q2 Q1 REAL GDP
LRAS1 AS1 PL1 E1 PRICE LEVELS AD1 0 fe Y1 REAL GDP
AS2 LRAS1 AS1 PL2 E1 PL1 E1 PRICE LEVELS AD1 0 fe Y2 Y1 REAL GDP
LRAS1 AS1 PL1 E1 PL2 E2 AD1 AD2 0 fe Y2 Y1 REAL GDP
SLF IR1 IR2 DLF DLF 0 Q2 Q1 LOANABLE FUNDS
LRAS1 AS1 PRICE LEVELS PL1 E1 AD1 0 Y1 fe REAL GDP
LRAS1 AS1 PL2 E2 E1 PL1 AD2 AD1 0 Y1 Y2 fe REAL GDP
LRAS1 AS1 AS2 PL1 E1 PL2 E2 AD1 0 Y1 Y2 fe REAL GDP
AS1 E1 P1 PRICE LEVELS P2 AD1 E2 AD2 0 fe Q2 Q1 REAL GDP
AS1 Ig is a determinant of AD. If the part changes, so does the whole. (C+Ig+G+X-M) P1 E1 PRICE LEVELS P2 E2 AD1 AD2 0 fe Q2 Q1 REAL GDP
LRAS1 LRAS2 AS is thought to be at Fe in the long-run. So the Long-run AS (LRAS) is vertical. E1 P1 P2 PRICE LEVELS E2 AD1 0 F-e-1 Fe-2 Q2 Q1 REAL GDP
MacroLinks: Change in the Axis's New Line on Graph Start with the Action “which causes”
MacroLinks: Change in the Axis's New Line on Graph Start with the Action AD and MD have a DIRECT Relationship “which causes”
MacroLinks: Change in the Axis's New Line on Graph Start with the Action AD and MD have a DIRECT Relationship “which causes”
MacroLinks: Change in the Axis's New Line on Graph Start with the Action “which causes”
$ Value of Current Year Basket CPI Inflation Index = X 100 $ Value of Base Year Basket
Nominal GDP = X 100 Real GDP CPI Index
MS1 MS2 IR1 i1 IR2 i2 MD1 0 Q2 Q1 MONEY MARKET
MS1 MS2 IR2 i2 IR1 i1 MD1 0 Q2 Q1 MONEY MARKET
MS1 i2 IR2 IR1 i1 MD2 MD1 0 Q1 MONEY MARKET
MS1 IR1 i1 i2 IR2 MD1 MD2 0 Q1 MONEY MARKET
LRPC1 IR1 A B IR2 SRPC1 SRPC2 0 UR1
A IR1 B IR2 SRPC1 SRPC2 0 UR2 UR1
B IR2 A IR1 SRPC2 SRPC1 0 UR1 UR2
B IR2 A IR1 SRPC1 0 UR2 UR1
A IR1 B IR2 SRPC1 0 UR1 UR2
Each point on the line represent a period in time. Ex: 2009 (CPI, UnRate) e1 represents the “current status” of CPI and the UnRate. e2 represents the “new status”AFTER the Fiscal or Fed Fix. Look at AD/AS graph to see which way it moves. The PHILLIPS Curve Downward Sloping Indicating the TRADE-OFF between keeping prices low and output (AD) high.