Download
1 / 41
420 likes | 493 Views
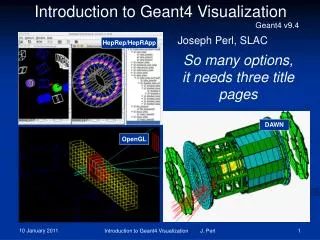
Explore the fundamentals of visualizing 3D data using meshes, surfaces, and volumes in computer graphics. Learn about pros and cons of surface versus volume graphics and differentiation of functions. Discover various data acquisition and imaging techniques.

E N D
Lecture 2 : Visualization Basics Bong-Soo Sohn School of Computer Science and Engineering Chung-Ang University
Surface Graphics • Objects are explicitely defined by a surface or boundary representation (explicit inside vs outside) • This boundary representation can be given by: • a mesh of polygons : • a mesh of spline patches
Surface Graphics : Pros and Cons • Pros : • fast rendering algorithms are available • acceleration in special hardware is relatively easy and cheap (many $200 game boards) • use OpenGL to specify rendering parameters • surface realism can be added via texture mapping • Cons : • discards the interior of the object and just maintains the object’s shell • does not facilitate real-world operations such cutting, slicing, disection • does not enable artificial viewing modes such as semi-transparencies, X-ray • surface-less phenomena such as clouds, fog, gas are hard to model and represent
Volume Graphics • Maintains a 3D image representation that is close to the underlying fully-3D object (but discrete)
Volume Graphics : Pros and Cons • Pros : • can achieve a level of realism (and ‘hyper-realism’) that is unmatched by surface graphics • allows easy and natural exploration of volumetric datasets • Cons : • has high rendering complexity Rendering of the inside of a human colon volume rendered surface rendered
Volumetric Image (3D image, volume) • it is a 3D array of point samples, called voxels (volume elements) • the point samples are located at the grid points • the process of generating a 2D image from the 3D volume is called volume rendering
Basics on Differentiation (of Scalar and Vector Function) • Refer to Prof. Han-Wei Shen’s Notes. • Useful for understanding images and gradients
Data Acquisition • Scanned/Sampled Data • CT/MRI/Ultrasound • Electron Microscopy • Computed/Simulated Data • Modeled/Synthetic Data
Time-Varying Data • Time-Varying Data from Scanning
Imaging Scanners • Scanners can yield both domains and functions on domains • Scanners yielding domains • Point Cloud Scanners: 300μ-800μ • CT, MRI: 10μ-200μ • Light microscopy: 5μ-10μ • Electron microscopy: < 1μ • Ultra microscopy like Cyro EM 50Å-100Å
Imaging Techniques • Computed Tomography (CT) • Measures spacially varying X-ray attenuation coefficient • Each slice 1-10mm thick • High resolution , low noise • Good for high density solids • Magnetic Resonance Imaging (MRI) • Measures distribution of mobile hydrogen nuclei by quantifying relaxation times • Moderate noise • Works well with soft tissue • Ultrasound • Handheld probe • Inexpensive, fast, and real-time • High noise with moderate resolution
Static Scalar Meshed Dense Time varying data Vector , Tensor Meshless Sparse Various Data Characteristics
Data Format • Mesh (Grid) Type • Regular • Rectilinear • Unstructured • Meshless • Mesh type conversion • Meshless to meshed
Mesh Types • Mesh taxonomy • Regular static meshes: • There is an indexing scheme, say i,j,k, with the actual positions being determined as i*dx, j*dy, k*dz. • If dx=dy=dz, then, • In 2-D, we get a pixel, and in 3-D, a voxel. dx A 2-D regular rectilinear grid dy
Mesh Types • Irregular static meshes: • Rectilinear: • Individual cells are not identical but are rectangular, and connectivity is related to a rectangular grid dx, dy are not constant in grid, but connectivity is similar in topology to regular grids. A 2-D regular rectilinear grid
Mesh types (contd) • Curvilinear: • Sometimes called structured grids as the cells are irregular cubes – a regular grid subjected to a non-linear transformation so as to fill a volume or surround an object. A 2-D curvilinear grid
Mesh Types (contd) • Unstructured: • Cells are of any shape (tetrahedral), hexahedra, etc with no implicit connectivity • Hybrid: • Combination of curvilinear and unstructured grids. • Dynamic (Time-varying) meshes
Triangulations (Delaunay) & Dual Diagrams (Voronoi) Meshless Data Meshed Data • Union of balls • Triangulation & Dual • Nerve sub-complex
Particle Data to Meshes A Weighted point P = ( p, wp ) where p x Power distance from with is the Euclidean distance
Power Diagram ( PD ) of a weighted point set Tiling of space into convex regions where ith region ( tile ) are the set of points in nearest to pi in the power distance metric. p1 p2 l1 l2 l Bisector Plane which matches power distance. Regular Triangulation ( RT ) Dual of Power Diagram ( PD ) with an edge of RT for each Bisector Plane of PD
Particle Data to Meshes Atomic Centers CPK CPK Alpha-Shape Solvent Accessible Surface (SAS) Power Diagram of SASSolvent Excluded Surface (SES)
Molecular Surfaces(Solvent Excluded Surface) toroidal patches + concave patches spherical patches + SES =
Field Data • Scalar temperature, pressure, density, energy, change, resistance, capacitance, refractive index, wavelength, frequency & fluid content. • Vector velocity, acceleration, angular velocity, force, momentum, magnetic field, electric field, gravitational field, current, surface normal • Tensor stress, strain, conductivity, moment of inertia and electromagnetic field • Multivariate Time Series
Interpolation • Interpolation/Approximation are often used to approximate the data on the domain • In other words, it constructs a continuous function on the domain
Linear Interpolation on a line segment p0pp1 The Barycentric coordinates α = (α0 α1) for any point p on line segment <p0 p1>, are given by fp f1 f f0 which yields p = α0p0 + α1 p1 and fp = α0f0 + α1 f1
Linear interpolation over a triangle p0 p1 p p2 For a triangle p0,p1,p2, the Barycentric coordinates α = (α0 α1 α2) for point p,
Linear interpolant over a tetrahedron Linear Interpolation within a • Tetrahedron (p0,p1,p2,p3) α = αi are the barycentric coordinates of p p3 p p0 p2 p1 fp3 fp fp2 fp0 fp1
Other 3D Interpolation • Unit Prism (p1,p2,p3,p4,p5,p6) p1 p2 p3 p p4 p5 p6 Note: nonlinear
Other 3D Interpolation • Unit Pyramid (p0,p1,p2,p3,p4) p0 p1 p2 p p3 p4 Note: nonlinear
Trilinear Interpolation • Unit Cube (p1,p2,p3,p4,p5,p6,p7,p8) • Tensor in all 3 dimensions p1 p2 p3 p4 p p5 p6 p7 p8 Trilinearinterpolant
Comparison • Bicubic vs Bilinear vs nearest point
Resampling • Used in image resize or data type conversion • Rectilinear to rectilinear • Unstructured to rectilinear
Rendering • Isocontouring (Surface Rendering) • Builds a display list of isovalued lines/surfaces • Volume Rendering • 3D volume primitives are transformed into 2D discrete pixel space
Isosurface Visualization • Isosurface (i.e. Level Set ) : • C(w) = { x | F(x) - w = 0 } ( w : isovalue , F(x) : real-valued function ) isosurfacing <medical> < ocean temperature function > < two isosurfaces (blue,yellow) > <bio-molecular> • Surface Topology : • Property that is invariant to continuous deformation (without cutting or gluing), e.g. donut & cup
Isocontouring • Popular Visualization Techniques for Scalar Fields 2. Isocontouring [Lorensen and Cline87,…] • Definition of isosurface C(w) of a scalar field F(x) • C(w)={x|F(x)-w=0} , ( w is isovalue and x is domain R3 ) 1.0 1.0 1.0 0.8 0.4 0.3 0.8 0.4 0.3 0.8 0.4 0.3 0.7 0.6 0.75 0.4 0.7 0.6 0.75 0.4 0.7 0.6 0.75 0.4 0.4 0.4 0.4 0.6 0.4 0.8 0.6 0.4 0.8 0.6 0.4 0.8 0.4 0.4 0.4 0.3 0.25 0.3 0.25 0.3 0.25 0.35 0.35 0.35 ( Isocontour in 2D function: isovalue=0.5 ) • Marching Cubes for Isosurface Extraction • Dividing the volume into a set of cubes • For each cubes, triangulate it based on the 2^8(reduced to 15) cases
Volume Rendering • Popular Visualization Techniques for Scalar Fields 1. Volume Rendering [Drebin88,…] C : color C: opacity I I’ C , C Light traversal from back to front I’= C C + (1- C)I <emission> <incoming light> <produced by CCV vistool> • Hardware Acceleration ( 3D Texturing ) [Westermann98] • Slicing along the viewing direction • Put 3D textures on the slice • Interactive color table manipulation
Transfer Function • Mapping from density to (color, opacity)