Download
1 / 7
70 likes | 182 Views
Solar Power Savings Potential For 12.6 MW Installation. District enjoys a long history as a resource conservation leader ( early 1980’s DOE and CEC grants/loans, multiple performance contracts in the 1990’s and 2000’s, adoption of Energy Policy)

E N D
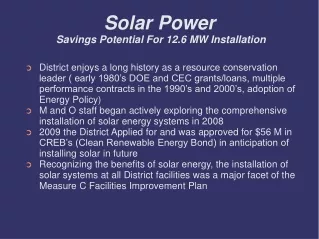
Solar Power Savings Potential For 12.6 MW Installation • District enjoys a long history as a resource conservation leader ( early 1980’s DOE and CEC grants/loans, multiple performance contracts in the 1990’s and 2000’s, adoption of Energy Policy) • M and O staff began actively exploring the comprehensive installation of solar energy systems in 2008 • 2009 the District Applied for and was approved for $56 M in CREB’s (Clean Renewable Energy Bond) in anticipation of installing solar in future • Recognizing the benefits of solar energy, the installation of solar systems at all District facilities was a major facet of the Measure C Facilities Improvement Plan
District Electrical Cost / Consumption • 2009 • $3,200,000* • Approximately 18 MW annual consumption* An initial analysis of District sites indicates that structures capable of producing at least 12.6MW could be installed (shade and parking) at District sites without having to utilize roof space. * According to PG&E supplied data
California Solar Initiative • In 2006 the CPUC collaborated with the CEC to develop the framework of the California Solar Initiative (CSI) through 2016 • For larger solar installations the CSI offers financial incentives based on actual performance of the system (s) for the first 5 yrs. • 1,750 Megawatts of incentives offered in 10 declining steps. Presently level 7 only has 1.5 megawatt left of eligibility until the program slips into level 8 • MDUSD has submitted applications/reservations @ level 7 for 12.6 MW of solar system installation • Reservation requires a refundable deposit
California Solar Initiative • Rebates for the installation of solar power • Based on the Watts installed/verified system performance • @ CSI level 7: 12.6 MW=$3,423,000/yr for 5 yrs (17 million over 5 years)* * The $2.8 million/yr cited in docket was based in a 10.4MW installation
PG&E vs Solar • PG&E has gone up 6.7% a year since 1970 • Owning our power source locks down the cost • Conservatively, we forecast with 5.5% • Includes a .7% per annum production degradation factor (industry standard is <.5%) 6.7% is from 1970 to 2005 data for calculation reference: http://www.eia.doe.gov/emeu/aer/elect.html
Cumulative Savings Forecast • Year after year cumulative savings • Based on avoiding utility increases (5.5%) • Includes California Solar Initiative rebates • 40 yr cumulative savings (cost avoidance) of approximately $386,000,000
Solar Energy Will Yield Long-Term Savings • Low Environmental Impact • Shade Structure Installations Enjoy a Very Low Level of Vulnerability to Vandalism and an Extremely High Level of Utility • Sustainable, Long-Term Energy Source • Reduced Carbon Footprint • Predictable Energy Cost • Underscores District’s Commitment to the Community as Stewards of resources/environment • Creates Real World Curriculum • Long Term Solution • Results in a conservative 40 yr cost avoidance (savings) of $386 Million Dollars