Download
1 / 18
180 likes | 309 Views
Algorithms for Association Mapping of Complex Diseases With Ancestral Recombination Graphs. Yufeng Wu UC Davis. Association (or LD) Mapping.

E N D
Algorithms for Association Mapping of Complex Diseases With Ancestral Recombination Graphs Yufeng Wu UC Davis RECOMB Satellite Workshop, 2007
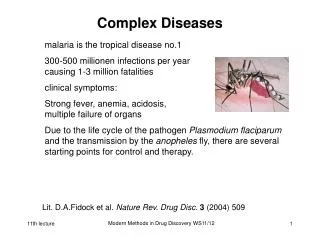
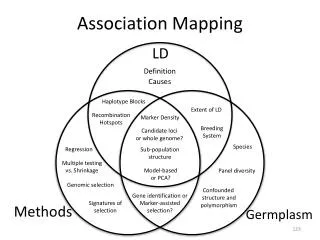
Association (or LD) Mapping • Given a subset of SNPs from unrelated individuals, find unobserved genetic variations that strongly discriminate individuals with the trait (cases) and those without the trait (controls) • Complex Diseases: difficult to map
Cases Controls SNP markers Illustration (Zollner and Pritchard, Genetics, 2005) 1: 001101 2: 110000 3: 001110 4: 001000 5: 000010 6: 111101 7: 100011 8: 110001 9: 110010 10: 100011 11: 010000 12: 101101
1 2 Some Challenges in Association Mapping
The Genealogy Approach • “..the best information that we could possibly get about association is to know the full coalescent genealogy…” – Zollner and Pritchard • Goal: infer genealogy from marker data with recombination • Approximation (e.g. in Zollner and Pritchard)
1 0 0 1 1 1 Ancestral Recombination Graph (ARG) Assumption: at most one mutation per site 10 11 01 00 10 01 00 S1 = 00 S2 = 01 S3 = 10 S4 = 11 S1 = 00 S2 = 01 S3 = 10 S4 = 10 Mutations Recombination
Full-ARG Approaches • First full ARG mapping method (Minichiello and Durbin) • Use full plausible ARG, but heuristic • Less complex disease model • Our results (Wu, 2007) • Sampling full ARGs with provable property, and work on more complex disease model • Focus on parsimonious history • minARGs: ARGs that use the minimum number of recombinations • Near minimum ARGs • Uniform sampling of minARGs
Special Case: ARG with Only Input Sequences • Self-derivability (SD) Problem: construct an ARG with only the input sequences • In fact, such ARG, if exits, must be a minARG • Runs in O(2n) time • Heuristics to extend to non-self-derivable data
N1=164 N2=76 00000 01000 01100 01101 11000 00010 00011 00000 01000 01100 11000 00010 11011 00011 11011 01101 Counting Self-derived ARGs N = 164*1 + 76*2 = 316 00000 01000 01100 01101 11000 00010 11011 00011 1 2
164 76 00000 01000 01100 01101 11000 00010 00011 00000 01000 01100 11000 00010 11011 00011 11011 01101 2. Pick seq = 11011 as last row to derive 3. Move to reduced matrix 316 00000 01000 01100 01101 11000 00010 11011 00011 1 2 1. Random value Rnd = 0.3 < 0.52 Select 11011 with prob = 164/316 = 0.52, and 01101 with prob = 76*2/316 = 0.48
ARGs Represents a Set of Marginal Trees • Clear separation of cases/controls: NOT expected for complex diseases!
Disease Model (Zollner & Pritchard) Disease mutations: Poisson Process Two alleles: wild-type and mutant 0.05 0.1 0.05 0.1 0.05 0.05 0.05 0.05
Disease Penetrance (Zollner & Pritchard) Case PA,1: probability of a mutant sequence becomes a case PC,1 = 1.0 - PA,1 PA,0: probability of a wild-type sequence becomes a case PC,0 = 1.0 - PA,0 Control 0.05 0.1 0.05 0.1 0.05 0.05 0.05 0.05
Phenotype Likelihood (Zollner and Pritchard) • Given a tree Tx at position x and case/control phenotype of its leaves, what is the probability Pr( | Tx) of observing on Tx? (Zollner & Pritchard) • Sum over all subset of mutated edges • Adopted in this work
Expected Phenotype Likelihood • Need for assessing statistical significance. • Null model: randomly permute case/control labels. • Our result: O(n3) algorithm for computing expected value of phenotype likelihood. • Exact, fully deterministic method.
Case Control Diploid Penetrance Diploid: two sequences per individual Diploid enetrance: PA,00: prob. Individual with two wild-type sequences becomes a case PA,01 : …, PA,11: … Efficient computation of phenotype likelihood: stated but unresolved in Zollner and Pritchard Our result (Wu, 2007): computing phenotype likelihood with diploid penetrance is NP-hard
Simulation Results Comparison: TMARG (uniform), TMARG (pathway), LATAG, MARGARITA
Acknowledgement • Software available at: http://wwwcsif.cs.ucdavis.edu/~wuyu • I want to thank • Dan Gusfield • Dan Brown • Chuck Langley • Yun S. Song