Download
1 / 1
10 likes | 196 Views
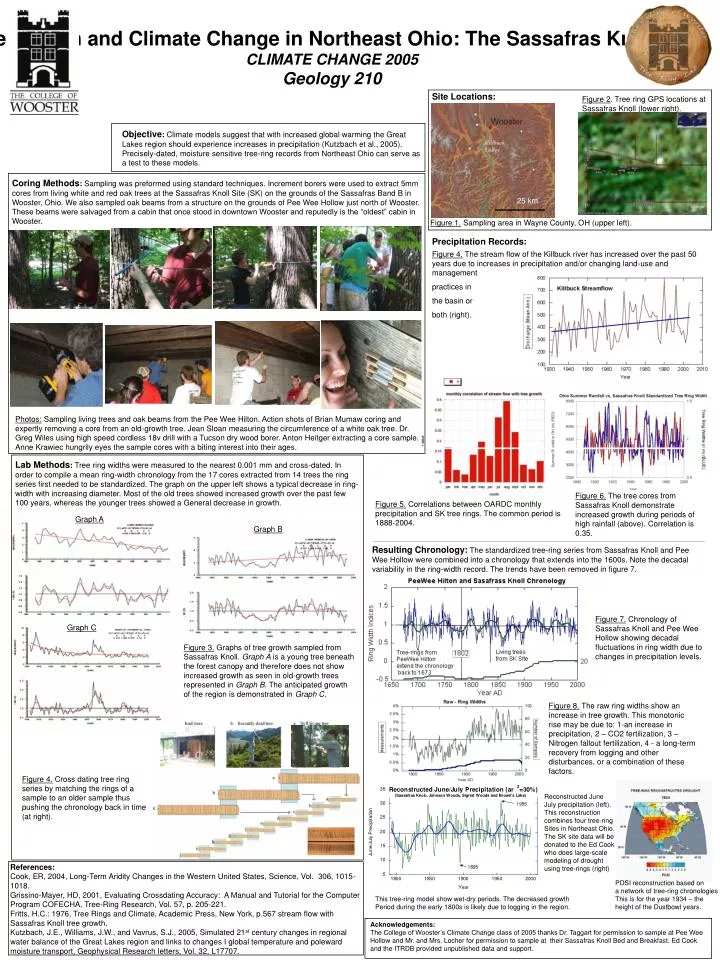
Tree Growth and Climate Change in Northeast Ohio: The Sassafras Knoll Site CLIMATE CHANGE 2005 Geology 210. Site Locations:. Figure 2 . Tree ring GPS locations at Sassafras Knoll (lower right).

E N D
Tree Growth and Climate Change in Northeast Ohio: The Sassafras Knoll Site CLIMATE CHANGE 2005 Geology 210 Site Locations: Figure 2. Tree ring GPS locations at Sassafras Knoll (lower right). Objective: Climate models suggest that with increased global warming the Great Lakes region should experience increases in precipitation (Kutzbach et al., 2005). Precisely-dated, moisture sensitive tree-ring records from Northeast Ohio can serve as a test to these models. Coring Methods: Sampling was preformed using standard techniques. Increment borers were used to extract 5mm cores from living white and red oak trees at the Sassafras Knoll Site (SK) on the grounds of the Sassafras Band B in Wooster, Ohio. We also sampled oak beams from a structure on the grounds of Pee Wee Hollow just north of Wooster. These beams were salvaged from a cabin that once stood in downtown Wooster and reputedly is the “oldest” cabin in Wooster. 25 km Figure 1. Sampling area in Wayne County, OH (upper left). Precipitation Records: Figure 4. The stream flow of the Killbuck river has increased over the past 50 years due to increases in precipitation and/or changing land-use and management practices in the basin or both (right). Photos:Sampling living trees and oak beams from the Pee Wee Hilton. Action shots of Brian Mumaw coring and expertly removing a core from an old-growth tree. Jean Sloan measuring the circumference of a white oak tree. Dr. Greg Wiles using high speed cordless 18v drill with a Tucson dry wood borer. Anton Heitger extracting a core sample. Anne Krawiec hungrily eyes the sample cores with a biting interest into their ages. Lab Methods: Tree ring widths were measured to the nearest 0.001 mm and cross-dated. In order to compile a mean ring-width chronology from the 17 cores extracted from 14 trees the ring series first needed to be standardized. The graph on the upper left shows a typical decrease in ring-width with increasing diameter. Most of the old trees showed increased growth over the past few 100 years, whereas the younger trees showed a General decrease in growth. 25 km Figure 6. The tree cores from Sassafras Knoll demonstrate increased growth during periods of high rainfall (above). Correlation is 0.35. Figure 5. Correlations between OARDC monthly precipitation and SK tree rings. The common period is 1888-2004. Graph A Graph B Resulting Chronology:Thestandardized tree-ring series from Sassafras Knoll and Pee Wee Hollow were combined into a chronology that extends into the 1600s. Note the decadal variability in the ring-width record. The trends have been removed in figure 7. Figure 7. Chronology of Sassafras Knoll and Pee Wee Hollow showing decadal fluctuations in ring width due to changes in precipitation levels. Graph C Figure 3. Graphs of tree growth sampled from Sassafras Knoll. Graph A is a young tree beneath the forest canopy and therefore does not show increased growth as seen in old-growth trees represented in Graph B. The anticipated growth of the region is demonstrated in Graph C. Figure 8. The raw ring widths show an increase in tree growth. This monotonic rise may be due to: 1-an increase in precipitation, 2 – CO2 fertilization, 3 – Nitrogen fallout fertilization, 4 - a long-term recovery from logging and other disturbances, or a combination of these factors. Figure 4.Cross dating tree ring series by matching the rings of a sample to an older sample thus pushing the chronology back in time (at right). Reconstructed June July precipitation (left). This reconstruction combines four tree-ring Sites in Northeast Ohio. The SK site data will be donated to the Ed Cook who does large-scale modeling of drought using tree-rings (right) References: Cook, ER, 2004, Long-Term Aridity Changes in the Western United States, Science, Vol. 306, 1015-1018. Grissino-Mayer, HD, 2001, Evaluating Crossdating Accuracy: A Manual and Tutorial for the Computer Program COFECHA, Tree-Ring Research, Vol. 57, p. 205-221. Fritts, H.C.: 1976, Tree Rings and Climate, Academic Press, New York, p.567 stream flow with Sassafras Knoll tree growth. Kutzbach, J.E., Williams, J.W., and Vavrus, S.J., 2005, Simulated 21st century changes in regional water balance of the Great Lakes region and links to changes I global temperature and poleward moisture transport, Geophysical Research letters, Vol. 32, L17707. PDSI reconstruction based on a network of tree-ring chronologies This is for the year 1934 – the height of the Dustbowl years. This tree-ring model show wet-dry periods. The decreased growth Period during the early 1800s is likely due to logging in the region. Acknowledgements: The College of Wooster’s Climate Change class of 2005 thanks Dr. Taggart for permission to sample at Pee Wee Hollow and Mr. and Mrs. Locher for permission to sample at their Sassafras Knoll Bed and Breakfast. Ed Cook and the ITRDB provided unpublished data and support.