Download
1 / 14
140 likes | 254 Views
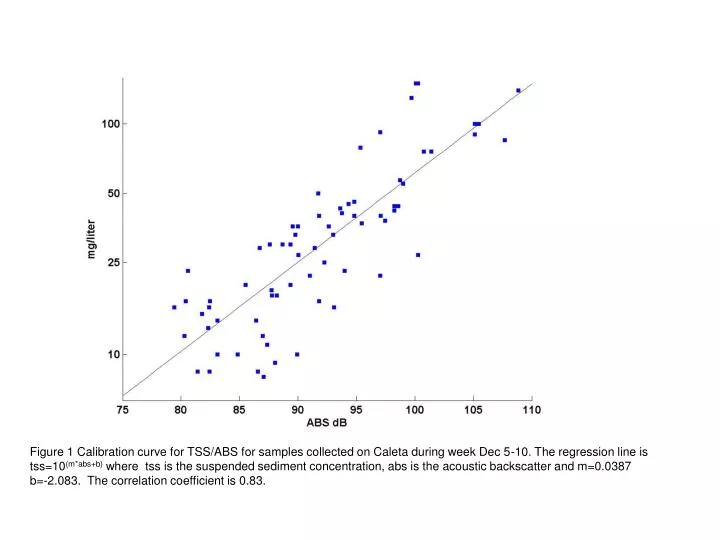
Figure 1 Calibration curve for TSS/ABS for samples collected on Caleta during week Dec 5-10. The regression line is tss=10 (m*abs+b) where tss is the suspended sediment concentration, abs is the acoustic backscatter and m=0.0387 b=-2.083. The correlation coefficient is 0.83.

E N D
Figure 1 Calibration curve for TSS/ABS for samples collected on Caleta during week Dec 5-10. The regression line is tss=10(m*abs+b) where tss is the suspended sediment concentration, abs is the acoustic backscatter and m=0.0387 b=-2.083. The correlation coefficient is 0.83.