Download
1 / 20
210 likes | 228 Views
Discoveries and implications of low-frequency detections of SgrA*, new filaments, and complex magnetic field structures in the Galactic Center, along with radio/sub-mm spectrum insights and ongoing research efforts.

E N D
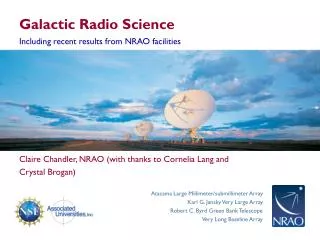
The Galactic Center at Low Radio Frequencies Namir Kassim (NRL) Crystal Brogan (IfA) J. Lazio (NRL), Ted LaRosa (Kennesaw State), M. Nord (NRL/UNM), W. M. Goss (NRAO), N. Duric (UNM), & K. Anantharamaiah (RRI) 30th Anniversary of the Discovery of SgrA* March 26, 2004
The Radio/Sub-mm Spectrum of Sgr A* • Until recently, Sagittarius A* was undetected below 1.4 GHz. • The source was thought to be undetectable due to foreground thermal (free-free) absorption. Sub-mm - Zhao, Bower, & Goss (2001) Radio - Zhao, Bower, & Goss (2001)
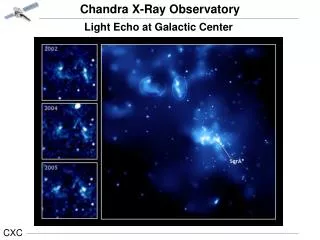
Grey scale 330 MHz (non-thermal) • Contours 5 GHz (thermal ionized gas) SgrA* Slices through position of SgrA* at 330 MHz
The New Radio/Sub-mm Spectrum of Sgr A* • We have detected SgrA* at the lowest frequency. • The line of sight (free-free) optical depth to Sgr* is most likely low (330 MHz<0.4). • Local clearing of the ambient gas, or clumpiness in the ionized ISM? • Implications for emission mechanisms still being explored. Sub-mm - Zhao, Bower, & Goss (2001) Radio - Zhao, Bower, & Goss (2001) 610 MHz – Roy et al. (2003) 330 MHz – Nord et al. (2004, accepted) Sub-mm - Zhao, Bower, & Goss (2001) Radio - Zhao, Bower, & Goss (2001)
New GC non-thermal filament: “The Pelican” (Lang, Anantharamaiah, et al. 1999) 330 MHz Galactic Center
Galactic Center: Many new NTFs • Orientation of newly discovered NTF’s suggests a magnetic field structure more complicated than a simple dipole • Detecting only the peak of the NTF luminosity function? • A significant increase in sensitivity might detect hundreds of NTFs. VLA A+B conf. ~10” resolution
Before After Galactic Center Transients n = 330 MHz Hyman, Lazio, Nord, & Kassim 2002
Coming soon – new ABCD+GBT image rms ~ 1 mJy (vs. 5) ~ 6” (vs. 45”) Created using “Feathering” technique developed by Bill Cotton
VLA 74 MHz (4 m) Image • VLA 4m resolution 2.1’ x 1.2’ using A+B+C+D config. Data • Peak ~ 35 Jy/beam • rms ~ 0.1 Jy/beam • Integrated Flux ~ 4000 Jy • Best previous images with n < 300 MHz have (eg. LaRosa & Kassim 1985): • resolutions > 7’ • ~40x less sensitivity
TGf TGb Inner Galaxy HII Region; t, Te Comparison of GC 4 m and 6 cm Images VLA 4m resolution 2.1’ x 1.2’ A+B+C+D config. data Parkes 6 cm resolution 4’: Haynes et al. 1978, AuJPS, 45, 1 SNR: W28 Galactic Center SNR: Tornado HII Region: NGC 6357 HII Region: NGC 6334
Bitran et al. 1997 CMZ: “Central Molecular Zone” Dame et al. 2001 The Central Molecular Zone • Enhanced synchrotron due to: • Increased density • Increased B • Increased star formation rate/cosmic rays a ~ -0.9 to -0.7
VLA 4m image resolution 2.1’ x 1.2’ using A+B+C+D config. data VLA 90 cm image resolution 2.1’ x 1.1’ using C+D config. data Nobeyama 3 cm image resolution 3’ Handa et al. 1989, PASJ, 39, 709 Close Up on the GC From 4m to 6cm
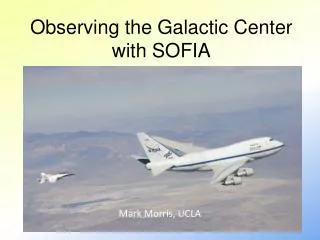
Bland-Hawthorn & Cohen (2003)MSX at 8.3 mm Radio Arc Sgr C Large Scale Outflows from the GC First identified by Sofue & Handa (1984) from Nobeyama 3 cm survey GC “Omega Lobe” East West
East Lobe • Partially non-thermal based on polarization (Haynes et al. 1992; Tsuboi et al. 1986) Parkes 3.5 cm Polarized intensity Radio Arc • West Lobe • Thermal based on deep 4m absorption Sgr C Haynes et al. (1992) Large Scale Outflows from the GC VLA 4 m Image Nobeyama 3 cm Image
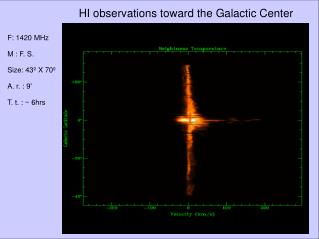
Absorption Near the GC (4m vs. 6cm) VLA 4 m Image Nobeyama 3 cm Image HII: Sgr D HII: Sgr B1 & B2 Sgr A West Diffuse HII Regions Sgr C HII: Sgr E
A 3-D Cartoon of the GC Region +200 km/s Central Molecular Zone Sgr D HII Sgr B2 HII Sgr B1 HII Sgr A* Diffuse HII Regions Sgr C 3 kpc Arm Sgr E -200 km/s Relative distance along line of sight
Summary of GC at Low Frequency • Lowest frequency detection of SgrA* • New nonthermal filaments imply complex B morphology • Ongoing wide field search for transient sources • True extent of low density GC synchrotron emission • - Encompasses CMZ “Central Molecular Zone” • - Confinement? Particle spectrum? B-field? • Identifying thermal gas near the GC from absorption • -Large scale outflow • - Sgr A West, Arched filaments, Sgr C • Resolving distance ambiguity for HII regions in absorption
HII Region Absorption Near SNR W28 HII Region: M8 D ~ 1.8 kpc HII Region: M20 D ~ 2 kpc HII Region: W28A-2 D ~ 4 kpc VLA 4m image resolution 2.1’ x 1.2’ Parkes 6cm image resolution 4’ Haynes et al. 1978, AuJPS, 45, 1
TGf TGb Inner Galaxy HII Region; t, Te Single dish Interferometer Tobs_i Tobs_s =0 Tobs_i =0 TGt Tobs_s TGt Single dish: Tobs_s = Te + TGf on source Tobs_s =TGt off source where TGt = TGf + TGb • Interferometer: Tobs_i = Te – TGb on source • (Negative ifTGb > Te) • Tobs_i=0 off source =>TGf = TGt – TGb • TGf = TGt + Tobs_i – Te • Emissivity= TGf/D Free-Free Absorption Observer • Nearby HII regions can be seen in absorption against Galactic synchrotron emission • Can be used to resolve distance ambiguity