Download
1 / 18
180 likes | 191 Views
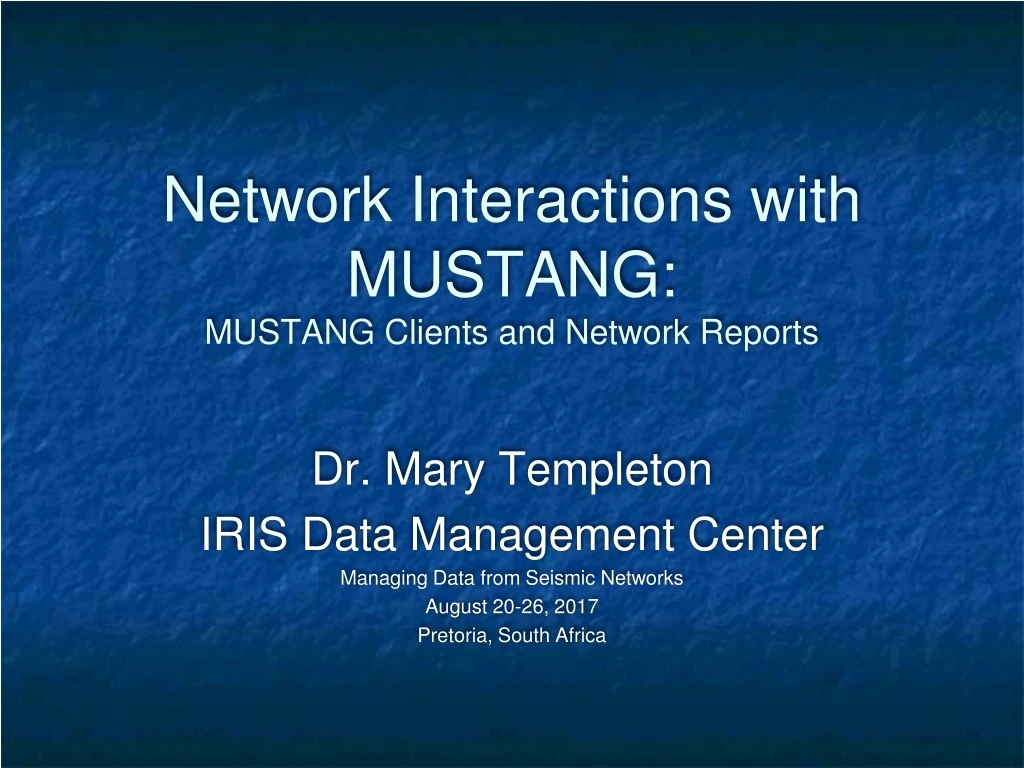
Network Interactions with MUSTANG: MUSTANG Clients and Network Reports. Dr. Mary Templeton IRIS Data Management Center Managing Data from Seismic Networks August 20-26, 2017 Pretoria, South Africa. Network Interactions. How you can QA your own network using MUSTANG clients LASSO

E N D
Network Interactions with MUSTANG:MUSTANG Clients and Network Reports Dr. Mary Templeton IRIS Data Management Center Managing Data from Seismic Networks August 20-26, 2017 Pretoria, South Africa
Network Interactions • How you can QA your own network using MUSTANG clients • LASSO • MUSTANG Databrowser • How IRIS staff QA networks • Writing custom scripts for metrics retrieval • Verifying and reporting data problems • Tracking problem resolution
LASSO: A MUSTANG Client • http://lasso.iris.edu/ • Displays MUSTANG metrics • In control-panel format • As time series • Ranks channels based on metrics values • Can display multiple metrics for virtual networks • Includes some derived metrics
LASSO: Basic Retrieval • Choose from 5 combinations • of measured or derived • metrics describing: • Mass position • Noise power • Signal quality • Time series integrity • Metadata validity Virtual networks only Quantitative ranks channels From 0 (all metrics poor) to 100 (all metrics good). Qualitative lists a count of good, fair and poor metrics.
LASSO Control Panel View • Qualitative ranking: • 2 good • 1 fair • 0 poor Click column name to sort
LASSO: Advanced Retrieval You choose metrics combinations Network or Virtual Network code
Completeness Metrics • Metrics combination • max_gap • num_gaps • percent_availability • Table type • Mean for Period • Start/End times • 2017-07-01 to 2017-07-08
IU Completeness Metrics Click cell to graph values: Outage began with a single “gap” Data stopped flowing on 2017/07/07
Other Metrics Combinations • Amplitude health • dead_channel_exp – seismic signal absent • low values suspect • pct_below_nlnm – low amplitude levels • high values suspect • pct_above_nhnm – noise • non-zero values suspect • sample_mean – mass drift • very high values suspect • sample_rms – amplitude variation • very low or very high values suspect
Other Metrics Combinations • Signal anomalies • cross_talk – same signal on multiple channels • Absolute values near 1suspect • dc_offset – step difference in sample_mean • High values suspect • num_spikes – transients lasting one to a few samples • High valuessuspect • sample_unique – count of unique amplitude values • Very high or very low values suspect
MUSTANG Databrowser: Another Client • http://ds.iris.edu/mustang/databrowser/ • Displays MUSTANG metrics • As network or station “boxplots” • As time series • Grouped with similar channels • Grouped with related metrics • Displays seismic traces • Displays PDF plots
Exploring Amplitude Healthwith Boxplots IU.BILL.00.BHZ has unusually high mean amplitudes!
Exploring Amplitude Health Seismic trace: drift is confirmed Metric Timeseries: Drift began April 8, 2017 PDF Plot: Seismic energy is absent
How IRIS staff QA networks • IRIS staff used to review waveforms to QA some special networks – staff intensive • We wanted to develop an automated metrics-based approach – less staff intensive • Special thanks to the Global Seismic Network and the Alaska Regional Network for their feedback as we tested this approach using their data
How IRIS staff QA networks • Custom R scripts retrieve metrics: Metric thresholds suggesting problem data
How IRIS staff QA networks • Verify and report data problems
How IRIS staff QA networks • Track Problem Resolution
Can Anyone Write Custom Clients? Yes!!! Here are two tutorials to help you learn more: Seismic Data Quality Assurance Using IRIS MUSTANG Metrics http://ds.iris.edu/ds/nodes/dmc/tutorials/seismic-data-quality-assurance-using-iris-mustang-metrics/ R Class for Seismologists http://ds.iris.edu/ds/nodes/dmc/tutorials/r-class-for-seismologists/