Download
1 / 26
260 likes | 293 Views
Learn how to analyze circuits using complex impedances with examples. Explore Bode plots for frequency response characterization. Understand impedance relationships and Thevenin equivalent circuits. Includes logarithmic measures like dB scales and power calculations.

E N D
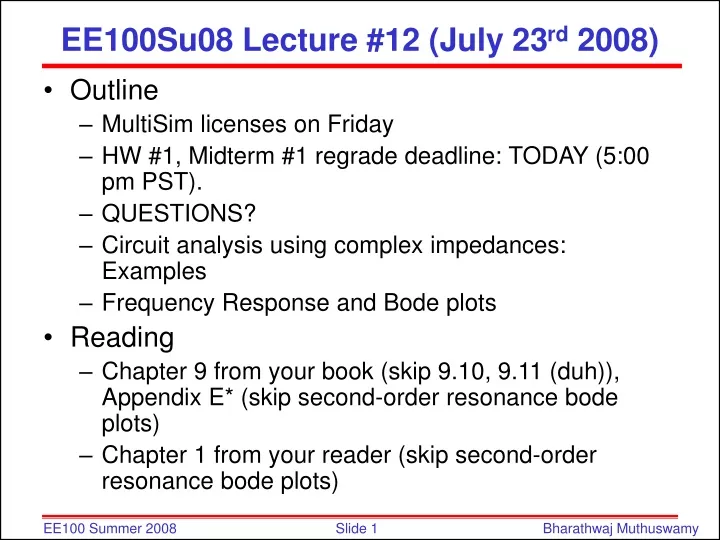
EE100Su08 Lecture #12 (July 23rd 2008) • Outline • MultiSim licenses on Friday • HW #1, Midterm #1 regrade deadline: TODAY (5:00 pm PST). • QUESTIONS? • Circuit analysis using complex impedances: Examples • Frequency Response and Bode plots • Reading • Chapter 9 from your book (skip 9.10, 9.11 (duh)), Appendix E* (skip second-order resonance bode plots) • Chapter 1 from your reader (skip second-order resonance bode plots)
Example: Single Loop Circuit f=60 Hz, VC=? 20kW + + VC 10V 0 1mF - - How do we find VC? First compute impedances for resistor and capacitor: ZR = R= 20kW = 20kW 0 ZC = 1/j (2pf x 1mF) = 2.65kW -90
Circuit Analysis Using Complex Impedances • Suitable for AC steady state. • KVL • Phasor Form KCL • Use complex impedances for inductors and capacitors and follow same analysis as in chap 2. Phasor Form KVL
Impedance Example 20kW 0 Now use the voltage divider to find VC: + + VC 2.65kW -90 10V 0 - -
What happens when w changes? w = 10 Find VC 20kW + + VC 10V 0 1mF - -
+ 0.1mF 5mA 0 V 1kW - + -j530kW 5mA 0 V 1kW - Steady-State AC Analysis Find v(t) for w=2p 3000
+ 5mA 0 Zeq V - Find the Equivalent Impedance
+ + -j3.5W 0.1mF 5mA 0 5mA 0 V V 1kW 1kW - - Change the Frequency Find v(t) for w=2p 455000
+ 5mA 0 Zeq V - Find an Equivalent Impedance
Z2 Zeq Z1 Z3 L2 L1 C1 C2 Series Impedance Zeq = Z1 + Z2 + Z3 For example: Zeq = jw(L1+L2)
Z1 Z2 Z3 Zeq C1 C2 L1 L2 Parallel Impedance 1/Zeq = 1/Z1 + 1/Z2 + 1/Z3 For example:
I1cos(wt) I0sin(wt) R L Steady-State AC Node-Voltage Analysis • Try using Thevinin equivalent circuit. • What happens if the sources are at different frequencies? VC + - C
Resistor I-V relationship vR = iRR ………….VR = IRR where R is the resistance in ohms, VR = phasor voltage, IR = phasor current (boldface indicates complex quantity) Capacitor I-V relationship iC = CdvC/dt ...............Phasor current IC = phasor voltage VC /capacitive impedance ZC: IC = VC/ZC where ZC = 1/jwC , j = (-1)1/2 and boldface indicates complex quantity Inductor I-V relationship vL = LdiL/dt ...............Phasor voltage VL = phasor current IL/inductive impedance ZL VL = ILZL where ZL = jwL, j = (-1)1/2 and boldface indicates complex quantity
Thevenin Equivalent ZTH f=60 Hz 10V 0 20kW + + + VC VTH 1mF - - - ZR = R= 20kW = 20kW 0 ZC = 1/j (2pf x 1mF) = 2.65kW -90
Bode Plots (Appendix E, Chapter 1 in Reader) • OUTLINE • dB scale • Frequency Response for Characterization • Asymptotic Frequency Behavior • Log magnitude vs log frequency plot • Phase vs log frequency plot • Transfer function example
Bel and Decibel (dB) • A bel (symbol B) is a unit of measure of ratios of power levels, i.e. relative power levels. • The name was coined in the early 20th century in honor of Alexander Graham Bell, a telecommunications pioneer. • The bel is a logarithmic measure. The number of bels for a given ratio of power levels is calculated by taking the logarithm, to the base 10, of the ratio. • one bel corresponds to a ratio of 10:1. • B = log10(P1/P2) where P1 and P2 are power levels. • The bel is too large for everyday use, so the decibel (dB), equal to 0.1B, is more commonly used. • 1dB = 10 log10(P1/P2) • dB are used to measure • Electric power, Gain or loss of amplifiers, Insertion loss of filters.
Logarithmic Measure for Power • To express a power in terms of decibels, one starts by choosing a reference power, Preference, and writing Power P in decibels = 10 log10(P/Preference) • Exercise: • Express a power of 50 mW in decibels relative to 1 watt. • P (dB) =10 log10 (50 x 10-3) = - 13 dB • Exercise: • Express a power of 50 mW in decibels relative to 1 mW. • P (dB) =10 log10 (50) = 17 dB. • dBm to express absolute values of power relative to a milliwatt. • dBm = 10 log10 (power in milliwatts / 1 milliwatt) • 100 mW = 20 dBm • 10 mW = 10 dBm
Logarithmic Measures for Voltage or Current From the expression for power ratios in decibels, we can readily derive the corresponding expressions for voltage or current ratios. Suppose that the voltage V (or current I) appears across (or flows in) a resistor whose resistance is R. The corresponding power dissipated, P, is V2/R (or I2R). We can similarly relate the reference voltage or current to the reference power, as Preference = (Vreference)2/R or Preference= (Ireference)2R. Hence, Voltage, V in decibels = 20log10(V/Vreference) Current, I, in decibels = 20log10(I/Ireference)
Logarithmic Measures for Voltage or Current Note that the voltage and current expressions are just like the power expression except that they have 20 as the multiplier instead of 10 because power is proportional to the square of the voltage or current. Exercise: How many decibels larger is the voltage of a 9-volt transistor battery than that of a 1.5-volt AA battery? Let Vreference = 1.5. The ratio in decibels is 20 log10(9/1.5) = 20 log10(6) = 16 dB.
Logarithmic Measures for Voltage or Current The gain produced by an amplifier or the loss of a filter is often specified in decibels. The input voltage (current, or power) is taken as the reference value of voltage (current, or power) in the decibel defining expression: Voltage gain in dB = 20 log10(Voutput/Vinput) Current gain in dB = 20log10(Ioutput/Iinput Power gain in dB = 10log10(Poutput/Pinput) Example: The voltage gain of an amplifier whose input is 0.2 mV and whose output is 0.5 V is 20log10(0.5/0.2x10-3) = 68 dB.
Bode Plot • Plot of magnitude of transfer function vs. frequency • Both x and y scale are in log scale • Y scale in dB • Log Frequency Scale • Decade Ratio of higher to lower frequency = 10 • Octave Ratio of higher to lower frequency = 2
Break point Break point Gain Gain High Pass Low Pass Frequency Frequency Frequency Response: Why? • The shape of the frequency response of the complex ratio of phasors VOUT/VIN is a convenient means of classifying a circuit behavior and identifying key parameters. FYI: These are log ratio vs log frequency plots