Download
1 / 51
510 likes | 791 Views
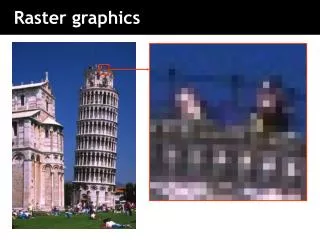
Raster Graphics and Color. Aaron Bloomfield CS 445: Introduction to Graphics Fall 2006. Overview. Display hardware How are images displayed? Raster graphics systems How are imaging systems organized? Color models How can we describe and represent colors?

E N D
Raster Graphics and Color Aaron Bloomfield CS 445: Introduction to Graphics Fall 2006
Overview • Display hardware • How are images displayed? • Raster graphics systems • How are imaging systems organized? • Color models • How can we describe and represent colors? • All non-credited images in this slide set are from Wikipedia
Overview • Display hardware • How are images displayed? • Raster graphics systems • How are imaging systems organized? • Color models • How can we describe and represent colors?
Display Hardware • Video display devices • Cathode Ray Tube (CRT) • Liquid Crystal Display (LCD) • Plasma panels • Thin-film electroluminescent displays • Light-emitting diodes (LED) • Hard-copy devices • Ink-jet printer • Laser printer • Film recorder • Electrostatic printer • Pen plotter
Anode connection Mask for separating beams for RGB part of displayed image Phosphor layer with RGB zones Close-up of the phos-phor-coated inner side of the screen Cathode Ray Tube (CRT) • Electron guns • Electron beams • Focusing coils • Deflection coils • Image via Wikipedia: http://en.wikipedia.org/wiki/Cathode_ray_tube
Liquid Crystal Display (LCD) Figure 2.16 from H&B
Display Hardware • Video display devices • Cathode Ray Tube (CRT) • Liquid Crystal Display (LCD) • Plasma panels • Thin-film electroluminescent displays • Light-emitting diodes (LED) • Hard-copy devices • Ink-jet printer • Laser printer • Film recorder • Electrostatic printer • Pen plotter
Overview • Display hardware • How are images displayed? • Raster graphics systems • How are imaging systems organized? • Color models • How can we describe and represent colors?
Raster Graphics Systems I/O Devices System Bus Display Processor CPU System Memory Video Controller Frame Buffer Monitor Figure 2.29 from H&B
Frame Buffer Frame Buffer Figure 1.2 from FvDFH
Frame Buffer Refresh Refresh rate is usually 60-120 Hz for CRTs Figure 1.3 from FvDFH
DAC Direct Color Framebuffer • Store the actual intensities of R, G, and B individually in the framebuffer • 24 bits per pixel = 8 bits red, 8 bits green, 8 bits blue
The red component only has the red components of each pixel (duh!) Monochromatic is a gray-scale image that uses another color instead of white Red component vs. monochromatic
DAC Color indices Color Lookup Framebuffer • Store indices (usually 8 bits) in framebuffer • Display controller looks up the R,G,B values before triggering the electron guns
Color CRT Figure 2.8 from H&B
Overview • Display hardware • How are images displayed? • Raster graphics systems • How are imaging systems organized? • Color models • How can we describe and represent colors?
Specifying Color • Color perception usually involves three quantities: • Hue: Distinguishes between colors like red, green, blue, etc • Saturation: How far the color is from a gray of equal intensity • Lightness: The perceived intensity of a reflecting object • Sometimes lightness is called brightness if the object is emitting light instead of reflecting it. • In order to use color precisely in computer graphics, we need to be able to specify and measure colors.
Pure Color Tints White Tones Grays Shades Black How Do Artists Do It? • Artists often specify color as tints, shades, and tones of saturated (pure) pigments • Tint: Adding white to a pure pigment, decreasing saturation • Shade: Adding black to a pure pigment, decreasing lightness • Tone: Adding white and black to a pure pigment
Additive color vs. Subtractive color • Additive colors models are used in light • Start with black, and add colored light to make your desired shade • Subtractive color models are used with paint • Start with white, and add colors • A given color – red – subtracts away (from the reflected light) any wavelength that is not red • Additive color mixing: • Subtractive color mixing:
HSV Color Model H S V Color 0 1.0 1.0 Red 120 1.0 1.0 Green 240 1.0 1.0 Blue * 0.0 1.0 White * 0.0 0.5 Gray * * 0.0 Black 60 1.0 1.0 ? 270 0.5 1.0 ? 270 0.0 0.7 ? Figure 15.16&15.17 from H&B
Intuitive Color Spaces • HSV is an intuitive color space • Corresponds to our perceptual notions of tint, shade,and tone • Hue (H) is the angle around the vertical axis • Saturation (S) is a value from 0 to 1 indicating how far fromthe vertical axis the color lies • Value (V) is the height of the “hexcone”
Precise Color Specifications • Pigment-mixing is subjective --- depends on human observer, surrounding colors, lighting of the environment, etc • We need an objective color specification • Light is electromagnetic energy in the 400 to 700 nm wavelength range • Dominant wavelength is the wavelength of the color we “see” • Excitation purity is the proportion of pure colored light to white light • Luminance is the amount (or intensity) of the light
Electromagnetic Spectrum • Visible light frequencies range between ... • Red = 4.3 x 10¹⁴ hertz (700nm) • Violet = 7.5 x 10¹⁴ hertz (400nm) Figures 15.1 from H&B
Visible Light • Hue = dominant frequency (highest peak) • Saturation = excitation purity (ratio of highest to rest) • Lightness = luminance (area under curve) White Light Orange Light Figures 15.3-4 from H&B
R B G B C R C G C = R + G + B C + R = G + B Color Matching • In order to match a color, we can adjust the brightness of 3 overlapping primaries until the two colors look the same. • C = color to be matched • RGB = laser sources (R=700nm, G=546nm, B=435nm) • Humans have trichromatic color vision
Linear Color Matching • Grassman’s Laws: • Scaling the color and the primaries by the same factor preserves the match: 2C = 2R + 2G + 2B • To match a color formed by adding two colors, add the primaries for each color C1 + C2 = (R1 + R2) + (G1 + G2) + (B1 + B2)
RGB Spectral Colors • Match each pure color in the visible spectrum (rainbow) • Record the color coordinates as a function of wavelength ?
Perception of color intensities • Which shade of gray is half-way between white and black? • It’s the second one • Humans perceive color intensity (and sound, etc.) on a logarithmic scale • The first one is (about) 3/4 lit • We perceive it as 1/2 lit • The second one is 1/2 lit • We perceive it as 1/4 lit • That exponent is called gamma () • 2.0 is a sample value for a CRT or LCD monitor
Human Color Vision • Humans have 3 light sensitive pigments in their cones, called L, M, and S • The cones respond to different lights: • L to red • M to green • S to blue • This leads tometamerism • “Tristimulus” color theory
Just Noticeable Differences • The human eye can distinguish hundreds of thousands of different colors • When two colors differ only in hue, the wavelength between just noticeably different colors varies with the wavelength! • More than 10 nm at the extremes of the spectrum • Less than 2 nm around blue and yellow • Most JND hues are within 4 nm. • Altogether, the eye can distinguish about 128 fully saturated hues • Human eyes are less sensitive to hue changes in less saturated light (not a surprise)
Compare color source to a gray source Luminance Y = .30R + .59G + .11B Color signal on a black and white TV Luminance
Chromaticity and the CIE • Negative spectral matching functions? • Some colors cannot be represented by RGB • Enter the CIE • Three new standard primaries called X, Y, and Z • Y has a spectral matching function exactly equal to the human response to luminance
Match all visible colors with only positive weights Y matches luminance These functions are defined tabularly at 1-nm intervals Linear combinations of the R,G,B matching functions XYZ Matching Functions
From http://pages.infinit.net/graxx/Theorie4.html Human perceptual gamut The cone keeps going towards the right Brightness (not whiteness!) keeps increasing Spectral Locus
Chromaticity Diagram Converting from RGB to XYZ is a snap: Given x, y, and Y, we can recover the X,Y,Z coordinates
Measuring Color • Colorimeters measure the X, Y, and Z values for any color • A line between the “white point” of the chromaticity diagram and the measured color intersects the horseshoe curve at exactly the dominant wavelength of the measured color • A ratio of lengths will give the excitation purity of the color • Complementary colors are two colors that mix to produce pure white • Some colors are non-spectral --- their dominant wavelength is defined as the same as their complimentary color, with a “c” on the end
Monitor gamuts are RGB Printer gamuts are CMYK Each can display colors the other cannot Gamut problems
add green add green A Problem With XYZ Colors • If we have two colors C1 and C2, and we add C to both of them, the differences between the original and new colors will not be perceived to be equal • C1: • C2: • This is due to the variation of the just noticeable differences in saturated hues • XYZ space is not perceptually uniform • LUV space was created to address this problem
The RGB Color Model • This is the model used in color CRT monitors • RGB are additive primaries • We can represent this space as a unit cube: From http://ian-albert.com/graphics/rgb.php
More on RGB • The color gamut covered by the RGB model is determined by the chromaticites of the three phosphors • To convert a color from the gamut of one monitor to the gamut of another, we first measure the chromaticities of the phosphors • Then, convert the color to XYZ space, and finally to the gamut of the second monitor • We can do this all with a single matrix multiply
The CMY Color Model • Cyan, magenta, and yellow are the complements of red, green, and blue • We can use them as filters to subtract from white • The space is the same as RGB except the origin is white instead of black • This is useful for hardcopy devices like laser printers • If you put cyan ink on the page, no red light is reflected
CMYK • Most printers actually add a fourth color, black • Use black in place of equal amounts of C, M, and Y • Why? • Black ink is darker than mixing C, M, and Y • Black ink is cheaper than colored ink
You can create (more or less) any color with each gamut Colored printer ink is more expensive Notice how much less CMY is needed in the CMYK version One of the reasons printers use CMYK And color mixing… CMY vs CMYK
The YIQ Color Model • YIQ is used to encode television signals • Y is the CIE Y primary, not yellow • Y is luminance, so I and Q encode the chromaticity of the color • If we just throw I and Q away, we have black and white TV • This assumes known chromaticities for your monitor • Backwards compatibility with black and white TV • More bandwidth can be assigned to Y
HSV color space aside • Consider a HSV picture space: • Blue and red are at right angles to each other • Thus, with 2 coordinates, you can define any saturation/hue combination • Let’s call the blue axis Cb • It defines the blue/yellow combination • And the red axis Cr • It defines the red/cyan combination
The YCbCr Color Model • Y is luma (similar to luminance) • The brightness of a pixel • Cb and Cr define the chrominance • Meaning they each define saturation and hue • Cb is the blue chroma, Cr is the red • From the last slide • Notice the murkiness of the Cr and Cb components • The human eye does not notice differences in them nearly as much
JPEG Image Compression • Take an image in the (r,g,b) color space • Assume it’s 8 bits per image (24 bits total) • Convert it to YCbCr • Also 8 bits per image • Downsample Cb and Cr to fewer bits • Let’s say 4 bits (24 = 16) • So it can have values 0, 15, 31, 47, … 255 • Each pixel now takes up 16 bits • 8 for Y, 4 for Cb and 4 for Cr • Then do some other magic (including zip-like compression) • And you have a (lossy) compressed image
Future color displays may have more pixels RGB plus yellow, cyan, etc. Will allow much more vivid color A greater gamut of color possibilities Note that both the pictures on the right are being displayed by an RGB output device… Future of color displays