Download
1 / 5
180 likes | 1.15k Views
Click mouse to view slides. The Dupont Chart as an Analysis and Reporting Tool. Morrison & Associates San Francisco. Strategic Drivers. Operating Drivers. Original DuPont Chart. The idea has been extended forward to shareholder value. Price. Revenue/ customer. Mar- gin.

E N D
Click mouse to view slides The Dupont Chartas an Analysis and Reporting Tool Morrison & Associates San Francisco
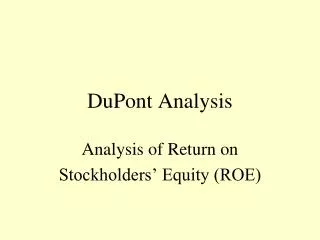
Strategic Drivers Operating Drivers Original DuPont Chart The idea has been extended forward to shareholder value. Price Revenue/customer Mar-gin Industryattract-iveness Cost High-LevelFinancial Drivers Customer servicelevel ROI W/C Receiv-ablespolicy Compe-titive position Turn-over ROE NFA Sourcingcosts CashFlow FinancingContribution ..and back to the operating and strategic drivers of value. The Original Dupont chart* showed the simple relationship: NIGrowth Value Cost ofCapital * Invented in 1919 by a Dupont engineer who joined the finance department Dupont Chart Evolution Showing the trade-offs for creating value is particularly helpful to non-financial managers.
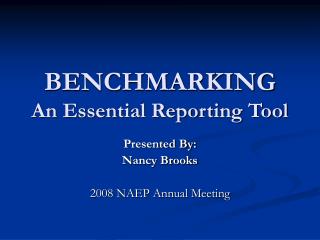
FinancingContribution Cash Turn 1823 EBIT Margin 9.9% 75 5.1% NOPAT Margin 7.3% 8.9% A/R Turn 4.5% 93 5 4.5% Pre-Fin. Tax ROE Inventory Turn 2.8% 37% 3.5% 17% 7.8 6.3 ROI Prepaid Exp. Turn CA Turn 27% 1075 7.1 12% 153 2.7 Higher W/C Turn Same CapitalTurn 17 5 Lower 6.0 Payables Turn CL Turn 2.7 19 12 6 12 Key NFA Turn General Merchandise Retailer Index Other CL Turn Wal-Mart 9.1 6.0 32 12 XX YY Benchmarking ExampleWal-Mart vs. General Merchandise Retailers Index The Dupont chart is highly useful for benchmarking. Here we see that Wal-Mart can sustain lower margins because it turns its assets much faster than its average competitor.
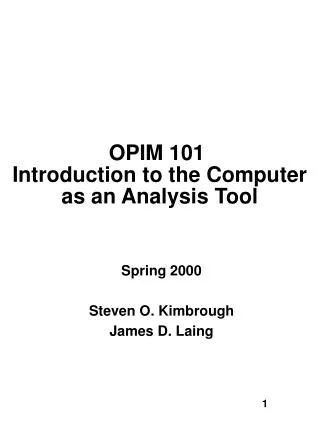
Gross Margin Revenue ($M) 32.4% 1152 Operating Margin .89 .89 .98 .98 33.1% 1293 31% NOPAT Margin Standard Cost Corp Expense Cost of Goods .93 .93 33% 0.4% -741 -788 .22 .89 .86 17.7% Taxes (% of Sales) 1.8% -883 -857 .90 .90 Good Will Amortization 19.6% Labor Variances Hedging Gains -13.2% .98 -2.0% -12 15 -13.5% .55 1.07 2.4 -5 -1.9% 27 Working Capital Turnover Material Variances ROCE -40 19% -29 8.0 .50 .50 .82 .82 -5 -59 23% Receivables Turnover Mfg OH Variances Fixed Asset Turnover +5 10.3 1.43 .79 .79 NA .94 13.0 -16 1.52 Capital Turnover Payables Turnover Tax Liabilities Turnover -8.3 1.05 -4.35 .91 .91 .91 1.02 -9.2 1.16 -4.26 Inventory Turnover As an innovative reporting tool, the Dupont chart allows quickly tracing the causes of off-plan performance. Other Turnover Key 9.2 1.85 1.33 .86 6.9 2.15 Actual + Forecast Actual + Forecast Index Index Foreign Exchange Adjustment Budget Budget -.01 NA .02 Performance ReportingDuPont Format Example
For more information on Dupont charts or • Strategy consulting • Shareholder value consulting • William A. Morrison • Morrison & Associates • 220 Sansome Street • Suite 1100 • San Francisco, CA 94104 USA • 415-296-0960 • BillMorrison@compuserve.com