Download
1 / 10
100 likes | 216 Views
Chapter 2. Economic Models. Link to syllabus. Skip ‘comparative advantage,’ pages 33-36, Figures 2-4 to 2-6. We won’t cover circular flow diagrams, like Figure 2-7. We won’t cover the appendix. Figure 2-1 p. 28. Production Possibility Frontier. Definitions of PPF and Opportunity Costs.

E N D
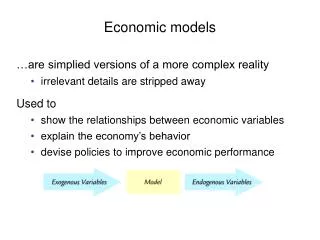
Chapter 2. Economic Models Link to syllabus Skip ‘comparative advantage,’ pages 33-36, Figures 2-4 to 2-6. We won’t cover circular flow diagrams, like Figure 2-7. We won’t cover the appendix.
Definitions of PPF and Opportunity Costs Production possibility frontier shows the maximum amount of one good that can be produced for any given quantity of the other. (p. 28) Opportunity cost of X in terms of Y: how much of Y that has to be given up in order to get another unit of X. (referenced on page 7).
Another example of opportunity costs Data for a Production Possibility Curve X 0 1 2 3 4 5 Y 20 18 15 11 6 0 Opportunity cost of each new unit of X, in terms of # of Y 2 3 4 5 6
Description of the Theory of Comparative Advantage • The theory says that free trade is the best policy • Countries can maximize their ‘consumption’ (availability of goods and services), because… • They maximize their production, producing those things at which they are most efficient (their comparative advantage), and • Theory assumes full employment • Theory ignores distribution of benefits inside the country – that’s another issue
Figure 2.4 p. 33. The Production Possibility Curves for Two Countries These figures will not be covered in this course!
Figure 2.6 p. 38. Circular Flow Diagram We will not use these graphs in this course.
Figure 7.1 p. 189 .Circular Flow (more complicated) Circular flow diagrams will not be included in this course.