Download
1 / 16
160 likes | 264 Views
An Analytic Method for Estimation of Electric Vehicle Range Requirements, Electrification Potential and Prospective Market Size*. *Population Statisticians and Behavioral Economists, please hold all criticism until the speaker has left the venue. Mike Tamor Chris Gearhart Ford Motor Company.

E N D
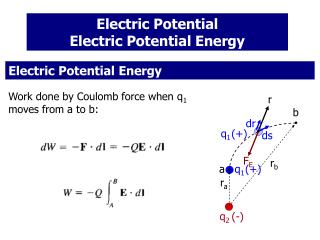
An Analytic Method for Estimation of Electric Vehicle Range Requirements, Electrification Potential and Prospective Market Size* *Population Statisticians and Behavioral Economists, please hold all criticism until the speaker has left the venue. Mike Tamor Chris Gearhart Ford Motor Company
The Core Issue The ‘Electric Vehicle Paradigm’ is inverted relative to a chemically fueled vehicle: the ‘fuel’ can be very cheap while the ‘fuel tank’ is extremely expensive. Traditional means of determining requisite attributes, most importantly range, customer willingness-to-pay and ultimate market acceptance may not apply. Because of the extreme cost sensitivity to range, and variability of use, estimates based on the ensemble behavior of large populations may be misleading.
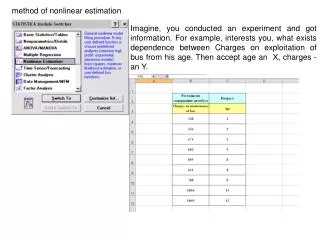
America’s Favorite Ensemble: the National Household Travel Survey (NHTS) • Data Collected (from ~200,000 household interviews) • The NHTS/NPTS serves as the nation’s inventory of daily travel. • Data is collected on daily trips taken in a (single) 24-hour period 4 am – 3:59 am), and includes: • purpose of the trip (work, shopping, etc.); • means of transportation used (car, bus, subway, walk, etc.); • how long the trip took, i.e., travel time; • time of day when the trip took place; • day of week when the trip took place; and • if a private vehicle trip: • - number of people in the vehicle , i.e., vehicle occupancy; • driver characteristics (age, sex, worker status, education level, etc.); • - vehicle attributes (make, model, model year, amount of miles driven in a year).
(Mis)Interpretation of Ensemble Data: Cumulative Daily Distance Distribution “100 miles electric range can electrify 69% of all driving” “100 miles electric range can electrify 93% of all trips” “100 km autonomy range satisfies more than 80% of daily use globally” http://www.udel.edu/udaily/2011/may/electric-vehicles-051711.html These statements hold for the ensemble if every respondent had the same EV whether or not it benefited him/her. These statements hold for an individual if he/she had the EV and drove a distribution of trip lengths matching the ensemble. Neither condition is met in the real world.
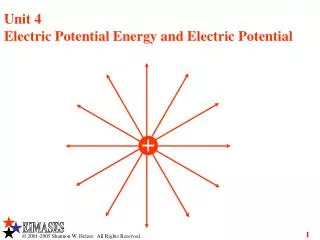
The Parts are Much More Complex than the Whole: we must treat people as individuals
Individual Trip Chain Frequency Distributions do Not Resemble the Ensemble! NHTS Example: Four of 132 vehicles instrumented for ~1year in Minnesota
Generic Parameterization of the Individual Trip Chain Frequency Distribution Random Background Habitual Peak 7
How Many Will Accept EV Range Limitations? Acceptance of EVs is expected to be sensitive to customer reactions to the need for alternative transportation. Market studies must capture the needs and alternatives for occasional uses rather than focus on typical usage!
How Much Range is Enough*?*to achieve a given level of electrification The electric range required to achieve a given level of electrification is extremely sensitive to the threshold for EV ‘acceptance’. 150 miles
How Much Range is Too Much? Assumes 24 days/year for alternative transportation is acceptable Assumes 8 days/year for alternative transportation is acceptable 150 200 mi. 150 $100/kWh 250 100 150 • With no economic penalty for choosing a larger battery, customer acceptance of EV, and total electrification is limited only by vehicle range. • With finite cost, ‘optimum’ range is roughly 150-200 miles (~independent of cost) • This is near the limits of what is feasible with near-future Li-ion technology. • If customers demand cost breakeven AND high functionality, battery cost must be impossibly low (<$100/kWh).
What if you could electrify the first N-miles of every trip … and keep going? The Plug-In Hybrid Total Electrification Benefit • Only 20 miles electric range would electrify 50% of travel! • 100% ‘acceptance’ (no range issues) • Faster payback because battery capacity used much more. • Total electrification potential of PHEV is vastly greater than that of EV! Battery Not Discharged By End of Day: ‘EV’ Battery Discharged By End of Day
What else can we do with this method? By identifying correlations between the four fit parameters, it is possible to generate synthetic driving population data. Estimation of average and distribution of real-world fuel economy reports for comparison to labels. Analytic estimates of EV acceptance and electrification potential to guide marketing and infrastructure priorities. By asking the right questions, we can estimate the fit parameters and generate a trip length distribution for an individual. Better prediction of individual fuel economy. Personal estimate of electrification benefits.
Individual Electrification Benefit Estimation The ‘Four Questions’ How many miles do you drive annually? Roughly how many days per year do you use your vehicle? Typically 240-300 How many days per week do you commute? Multiply by 0.8 to reflect vacation, holidays, etc. What is the round-trip distance of your commute?
PHEV Benefit Estimator Output Note this is a crude prototype. Final version can have vehicle data base including non-HEV, including depletion strategy assumptions (Volt vs. Energi).
Summary (too soon for ‘Conclusions’) Estimates based on aggregate information are poor predictors of individual electrification needs and benefits. Statistical characterization of individual usage data can be used to generate realistic synthetic populations. Methodology can be used to improve estimates of individual benefit, EV market penetration and ultimate electrification potential. Market studies must capture occasional use and individual transportation alternatives. Work in progress examines similar data from multiple regions to determine generality and scalability of the driver population model. We need a lot more data!