Download
1 / 4
40 likes | 97 Views
Discover the breakdown of different business types in the U.S., their employee distribution, and revenue contributions. Corporations dominate, providing majority of jobs and almost 90% of revenues.

E N D
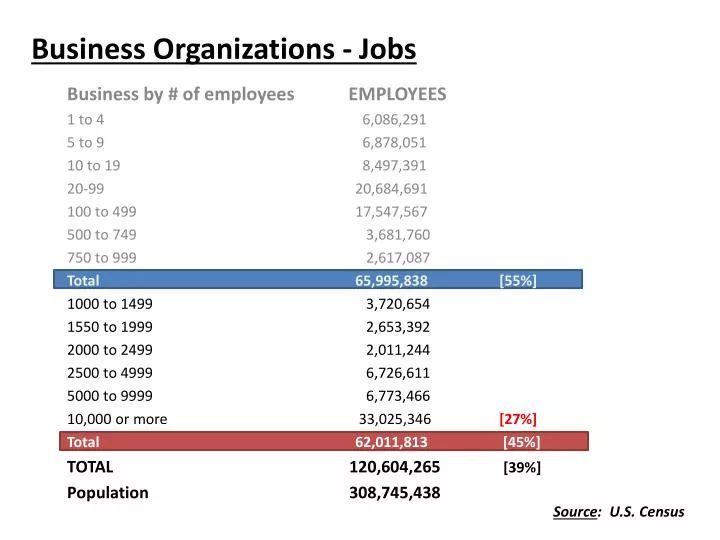
Business Organizations - Jobs Business by # of employees EMPLOYEES 1 to 4 6,086,291 5 to 9 6,878,051 10 to 19 8,497,391 20-99 20,684,691 100 to 499 17,547,567 500 to 749 3,681,760 750 to 999 2,617,087 Total 65,995,838 [55%] 1000 to 1499 3,720,654 1550 to 1999 2,653,392 2000 to 2499 2,011,244 2500 to 4999 6,726,611 5000 to 9999 6,773,466 10,000 or more 33,025,346 [27%] Total 62,011,813 [45%] TOTAL 120,604,265 [39%] Population 308,745,438 Source: U.S. Census
Comparing Corporations, Partnerships, & Proprietorships • 8.7% Partnerships • 18.9% Corporations • 72.4% Proprietorships BUSINESS TYPES • Revenues $$$ • 6.1% Partnerships • 89.7% Corporations • 8.7% Proprietorships Source: U.S. Census
Comparing Corporations, Partnerships, & Proprietorships CONCLUSION • Corporations make-up 1/5 of the businesses in the U.S.A. • Provide almost 45% of jobs. • Revenues $$$ • Generate almost 90% Source: U.S. Census
Corporation Structure Stockholders CEO CFO COO CIO Technology Accounting PRESIDENT Or EVP DIVISIONS Managers Workers