Download
1 / 1
10 likes | 200 Views
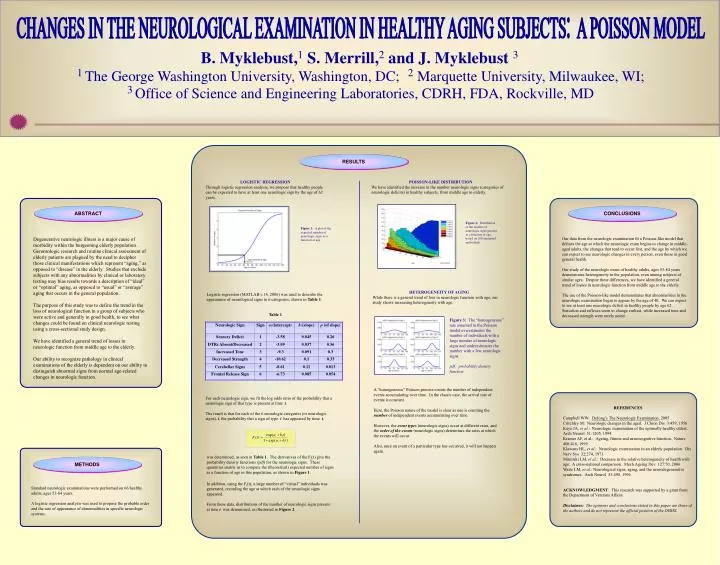
Figure 1: A plot of the expected number of neurologic signs as a function of age. Neurologic Sign. Sign. a i (intercept). b i (slope). p (of slope). Sensory Deficit. 1. -3.58. 0.045. 0.26. DTRs Absent/Decreased. 2. -3.09. 0.037. 0.36. Increased Tone. 3. -9.3. 0.091. 0.3.

E N D
Figure 1: A plot of the expected number of neurologic signs as a function of age. Neurologic Sign Sign ai(intercept) bi (slope) p (of slope) Sensory Deficit 1 -3.58 0.045 0.26 DTRs Absent/Decreased 2 -3.09 0.037 0.36 Increased Tone 3 -9.3 0.091 0.3 Decreased Strength 4 -10.62 0.1 0.33 Cerebellar Signs 5 -8.61 0.11 0.013 Frontal Release Sign 6 -6.73 0.085 0.054 CHANGES IN THE NEUROLOGICAL EXAMINATION IN HEALTHY AGING SUBJECTS: A POISSON MODEL B. Myklebust,1 S. Merrill,2 and J. Myklebust 31The George Washington University, Washington, DC;2Marquette University, Milwaukee, WI;3Office of Science and Engineering Laboratories, CDRH, FDA, Rockville, MD RESULTS LOGISTIC REGRESSION Through logistic regression analysis, we propose that healthy people can be expected to have at least one neurologic sign by the age of 62 years. POISSON-LIKE DISTRIBUTION We have identified the increase in the number neurologic signs (categories of neurologic deficits) in healthy subjects, from middle age to elderly. ABSTRACT CONCLUSIONS Figure 2: Distribution of the number of neurologic signs present as a function of age, based on 100 simulated individuals. Degenerative neurologic illness is a major cause of morbidity within the burgeoning elderly population. Gerontologic research and routine clinical assessment of elderly patients are plagued by the need to decipher those clinical manifestations which represent “aging,” as opposed to “disease” in the elderly. Studies that exclude subjects with any abnormalities by clinical or laboratory testing may bias results towards a description of “ideal” or “optimal” aging, as opposed to “usual” or “average” aging that occurs in the general population. The purpose of this study was to define the trend in the loss of neurological function in a group of subjects who were active and generally in good health, to see what changes could be found on clinical neurologic testing using a cross-sectional study design. We have identified a general trend of losses in neurologic function from middle age to the elderly. Our ability to recognize pathology in clinical examinations of the elderly is dependent on our ability to distinguish abnormal signs from normal age-related changes in neurologic function. Our data from the neurologic examination fit a Poisson-like model that defines the age at which the neurologic exam begins to change in middle-aged adults, the changes that tend to occur first, and the age by which we can expect to see neurologic changes in every person, even those in good general health. Our study of the neurologic exam of healthy adults, ages 53-84 years demonstrates heterogeneity in the population, even among subjects of similar ages. Despite these differences, we have identified a general trend of losses in neurologic function from middle age to the elderly. The use of the Poisson-like model demonstrates that abnormalities in the neurologic examination begin to appear by the age of 40. We can expect to see at least one neurologic deficit in healthy people by age 62. Sensation and reflexes seem to change earliest, while increased tone and decreased strength were rarely noted. HETEROGENEITY OF AGING While there is a general trend of loss in neurologic function with age, our study shows increasing heterogeneity with age. Logistic regression (MATLAB v.14, 2006) was used to describe the appearance of neurological signs in 6 categories, shown in Table 1. Table 1 Figure 3: The “homogeneous” rate assumed in the Poisson model overestimates the number of individuals with a large number of neurologic signs and underestimates the number with a few neurologic signs. pdf: probability density function A “homogeneous” Poisson process counts the number of independent events accumulating over time. In the classic case, the arrival rate of events is constant. Here, the Poisson nature of the model is clear as one is counting the number of independent events accumulating over time. However, the event types (neurologic signs) occur at different rates, and the order of the events (neurologic signs) determines the rates at which the events will occur. Also, once an event of a particular type has occurred, it will not happen again. For each neurologic sign, we fit the log odds ratio of the probability that a neurologic sign of that type is present at time t. The result is that for each of the 6 neurologic categories (or neurologic signs), i, the probability that a sign of type i has appeared by time t, REFERENCES Campbell WW: DeJong’s The Neurologic Examination, 2005 Critchley M: Neurologic changes in the aged. J Chron Dis 3:459, 1956 Kaye JA, et al.: Neurologic examination of the optimally healthy oldest. Arch Neurol 51:1205, 1994 Kramer AF, et al.: Ageing, fitness and neurocognitive function. Nature 400:418, 1999 Klawans HL, et al.: Neurologic examination in an elderly population. Dis Nerv Sys 32:274, 1971 Mitnitski LM, et al.: Decrease in the relative heterogeneity of health with age: A cross-national comparison. Mech Ageing Dev 127:70, 2006 Waite LM, et al.: Neurological signs, aging, and the neurodegenerative syndromes. Arch Neurol 53:498, 1996 ACKNOWLEDGMENT: This research was supported by a grant from the Department of Veterans Affairs Disclaimer: The opinions and conclusions stated in this paper are those of the authors and do not represent the official position of the DHHS. was determined, as seen in Table 1. The derivatives of the Fi(t) give the probability density functions (pdf) for the neurologic signs. These quantities enable us to compute the (theoretical) expected number of signs as a function of age in this population, as shown in Figure 1. METHODS In addition, using the Fi(t), a large number of “virtual” individuals was generated, recording the age at which each of the neurologic signs appeared. From these data, distributions of the number of neurologic signs present at time t was determined, as illustrated in Figure 2. Standard neurologic examinations were performed on 66 healthy adults, ages 53-84 years. A logistic regression analysis was used to propose the probable order and the rate of appearance of abnormalities in specific neurologic systems.