Download
1 / 34
340 likes | 491 Views
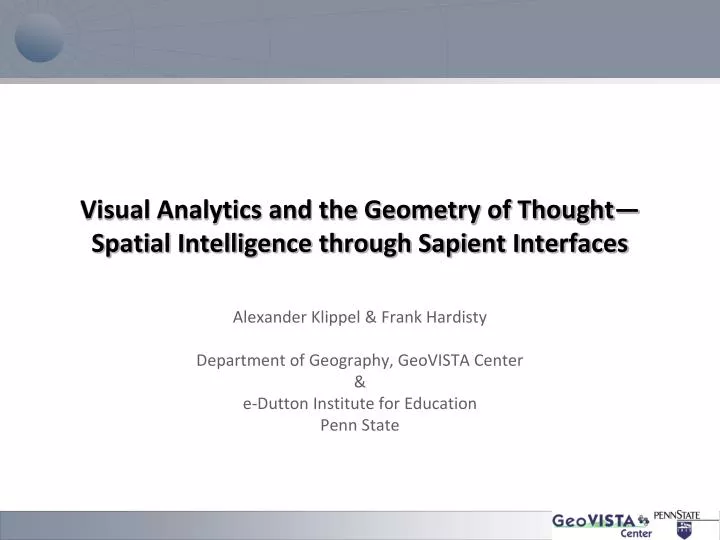
Visual Analytics and the Geometry of Thought— Spatial Intelligence through Sapient Interfaces. Alexander Klippel & Frank Hardisty Department of Geography, GeoVISTA Center & e-Dutton Institute for Education Penn State. Star Plots How Shape Characteristics Influence Classification Tasks.

E N D
Visual Analytics and the Geometry of Thought—Spatial Intelligence through Sapient Interfaces Alexander Klippel & Frank Hardisty Department of Geography, GeoVISTA Center & e-Dutton Institute for Education Penn State
Star PlotsHow Shape Characteristics InfluenceClassification Tasks Alexander Klippel & Frank Hardisty Department of Geography, GeoVISTA Center & e-Dutton Institute for Education Penn State
Overview • Multivariate data displays • Experiment on the influence of shape (of star plots) on the classification of data • Design of a tool to administer grouping experiments • Design of a tool to analyze individual similarity ratings • Does shape matter? • Conclusion and future work
Displaying Multivariate Data • We encounter limitations in displaying multivariate data in two dimensions • As a response to these constraints several graphic designs have been advised, for example • Andrews curves • Parallel plots • Chernoff faces • Star plots • Etc etc. • The big question is • Which visualization technique does “work” for which data sets and which does not
Chernoff Faces Source: http://mapmaker.rutgers.edu/355/links.html
Star Plots GeoViz Toolkit: http://www.geovista.psu.edu/grants/cdcesda/software/
Question • In their work on Chernoff faces Chernoff and Rizvi (1975) found that varying the assignment of variables to facial characteristics has an influence on classification tasks • Question • For star plots the assumption is made that the assignment of variables to rays does not matter, but is that really the case?
Experiment: Car Data 1-3-5-7 2-3-6-7 20 participants in each condition Penn State undergraduates
100- 85 100- 85 65- 50 30- 15
The Grouping Tool 1-3-5-7 81 icons (4 variables, 3 levels (high, medium, low))
The Grouping Tool 2-3-6-7 81 icons (4 variables, 3 levels (high, medium, low))
Example: All Low Values = 1-3-5-7 2-3-6-7
Data • Number of groups • Time to complete • Similarity matrix • Linguistic labels
Some Results • There is no statistically significant difference in the number of groups created in 1-3-5-7 and 2-3-6-7 (t = .241, df = 38, p = .811) • There is no statistical significant difference in the time participants needed to complete the task (t = -1.533, df = 38, p = .134) • The similarity values in both similarity matrices are correlated and the correlation is statistically significant (r = .581, N = 3240, p < .0005)
Cluster Analysis 1-3-5-7 2-3-6-7 Ward’s method
MDS Plots 1-3-5-7
MDS Plots 2-3-6-7
Grouping Analysis 2-3-6-7 1-3-5-7 Improvise by Chris Weaver (http://www.personal.psu.edu/cew15/improvise/index.html)
1-3-5-7 2-3-6-7
1-3-5-7 2-3-6-7
1-3-5-7 2-3-6-7
1-3-5-7 2-3-6-7
1-3-5-7 2-3-6-7
1-3-5-7 2-3-6-7
1-3-5-7 2-3-6-7
1-3-5-7 2-3-6-7
Conclusion • Shape does matter • The assignment of variable to rays in a star plot influences classification tasks (compare Chernoff faces) • Characteristic shape features have an influence on rating the similarity of the represented data • The more characteristic the shape, the greater the influence • It may therefore be that star plots are less suitable for lay person exploratory analysis but more effective in communication (if carefully chosen).
Outlook • Quantifying data analysis • Cluster validation methods • E.g., Rand statistic, Jaccard coefficient • Individual analysis of “shape families” • Relation to linguistic labels • Continue work on how should variables be assigned to rays • For example, is there a time advantage for salient shapes? • Influence of contextual parameters • Of a star plot as such (e.g. number of variables/rays) • As a symbol in a map (e.g. spatial patterns, and first law or geography). • Star plots in comparison to other visualization techniques