Download
1 / 44
440 likes | 470 Views
Explore the complex nature of the underlying event in hard scattering, crucial for modeling collider observables. Various modeling approaches and analyses are discussed to shed light on this challenging physics aspect.

E N D
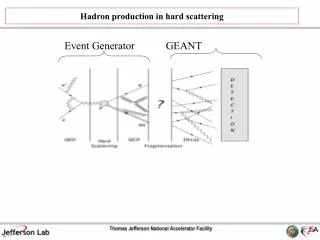
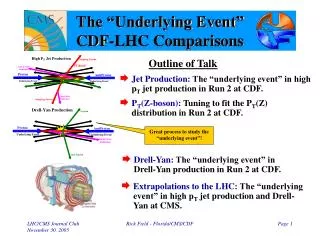
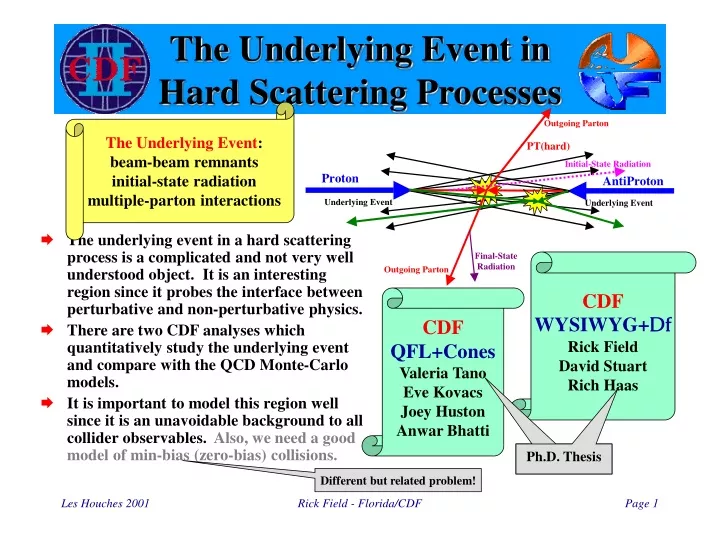
The Underlying Event inHard Scattering Processes The Underlying Event: beam-beam remnants initial-state radiation multiple-parton interactions • The underlying event in a hard scattering process is a complicated and not very well understood object. It is an interesting region since it probes the interface between perturbative and non-perturbative physics. • There are two CDF analyses which quantitatively study the underlying event and compare with the QCD Monte-Carlo models. • It is important to model this region well since it is an unavoidable background to all collider observables. Also, we need a good model of min-bias (zero-bias) collisions. CDF WYSIWYG+Df Rick Field David Stuart Rich Haas CDF QFL+Cones Valeria Tano Eve Kovacs Joey Huston Anwar Bhatti Ph.D. Thesis Ph.D. Thesis Different but related problem! Rick Field - Florida/CDF
Beam-Beam Remnants • The underlying event in a hard scattering process has a “hard” component (particles that arise from initial & final-state radiation and from the outgoing hard scattered partons) and a “soft” component (beam-beam remnants). • However the “soft” component is color connected to the “hard” component so this separation is (at best) an approximation. Min-Bias? • For ISAJET (no color flow) the “soft” and “hard” components are completely independent and the model for the beam-beam remnant component is the same as for min-bias (“cut pomeron”) but with a larger <PT>. • HERWIG breaks the color connection with a soft q-qbar pair and then models the beam-beam remnant component the same as HERWIG min-bias (cluster decay). Rick Field - Florida/CDF
Multiple Parton Interactions • PYTHIA models the “soft” component of the underlying event with color string fragmentation, but in addition includes a contribution arising from multiple parton interactions (MPI) in which one interaction is hard and the other is “semi-hard”. • The probability that a hard scattering events also contains a semi-hard multiple parton interaction can be varied but adjusting the cut-off for the MPI. • One can also adjust whether the probability of a MPI depends on the PT of the hard scattering, PT(hard) (constant cross section or varying with impact parameter). • One can adjust the color connections and flavor of the MPI (singlet or nearest neighbor, q-qbar or glue-glue). • Also, one can adjust how the probability of a MPI depends on PT(hard) (single or double Gaussian matter distribution). Rick Field - Florida/CDF
WYSIWYG: Comparing Datawith QCD Monte-Carlo Models Charged Particle Data QCD Monte-Carlo WYSIWYG What you see is what you get. Almost! • Zero or one vertex • |zc-zv| < 2 cm, |CTC d0| < 1 cm • Require PT > 0.5 GeV, |h| < 1 • Assume a uniform track finding efficiency of 92% • Errors include both statistical and correlated systematic uncertainties Select “clean” region Make efficiency corrections Look only at the charged particles measured by the CTC. • Require PT > 0.5 GeV, |h| < 1 • Make an 8% correction for the track finding efficiency • Errors (statistical plus systematic) of around 5% compare Small Corrections! Corrected theory Uncorrected data Rick Field - Florida/CDF
Charged Particle DfCorrelations • Look at charged particle correlations in the azimuthal angle Df relative to the leading charged particle jet. • Define |Df| < 60o as “Toward”, 60o < |Df| < 120o as “Transverse”, and |Df| > 120o as “Away”. • All three regions have the same size in h-f space, DhxDf = 2x120o = 4p/3. Rick Field - Florida/CDF
Charged Multiplicity versus PT(chgjet#1) • Data on the average number of “toward” (|Df|<60o), “transverse” (60<|Df|<120o), and “away” (|Df|>120o) charged particles (PT > 0.5 GeV, |h| < 1, including jet#1) as a function of the transverse momentum of the leading charged particle jet. Each point corresponds to the <Nchg> in a 1 GeV bin. The solid (open) points are the Min-Bias (JET20) data. The errors on the (uncorrected) data include both statistical and correlated systematic uncertainties. Underlying Event “plateau” Rick Field - Florida/CDF
Shape of an AverageEvent with PT(chgjet#1) = 20 GeV/c Includes Jet#1 Underlying event “plateau” Remember |h| < 1 PT > 0.5 GeV Shape in Nchg Rick Field - Florida/CDF
“Height” of the UnderlyingEvent “Plateau” Implies 1.09*3(2.4)/2 = 3.9 charged particles per unit h with PT > 0.5 GeV/c. Hard Soft 4 per unit h Implies 2.3*3.9 = 9 charged particles per unit h with PT > 0 GeV/c which is a factor of 2 larger than “soft” collisions. Rick Field - Florida/CDF
“Transverse” PT Distribution • Plot shows the PT distribution of the “Transverse” <Nchg>, dNchg/dPT. The integral of dNchg/dPT is the “Transverse” <Nchg>. • The triangle and circle (square) points are the Min-Bias (JET20) data. The errors on the (uncorrected) data include both statistical and correlated systematic uncertainties. Rick Field - Florida/CDF
“Transverse” PT Distribution • Comparison of the “transverse” <Nchg> versus PT(charged jet#1) with the PT distribution of the “transverse” <Nchg>, dNchg/dPT. The integral of dNchg/dPT is the “transverse” <Nchg>. Shows how the “transverse” <Nchg> is distributed in PT. PT(charged jet#1) > 30 GeV/c “Transverse” <Nchg> = 2.3 PT(charged jet#1) > 5 GeV/c “Transverse” <Nchg> = 2.2 Rick Field - Florida/CDF
“Max/Min Transverse” Nchg versus PT(chgjet#1) • Define “TransMAX” and “TransMIN” to be the maximum and minimum of the region 60o<Df<120o (60o<-Df<120o) on an event by event basis. The overall “transverse” region is the sum of “TransMAX” and “TransMIN”. The plot shows the average “TransMAX” Nchg and “TransMIN” Nchg versus PT(charged jet#1). • The solid (open) points are the Min-Bias (JET20) data. The errors on the (uncorrected) data include both statistical and correlated systematic uncertainties. Area DhDf 2x60o = 2p/3 “TransMAX” “TransMIN” Rick Field - Florida/CDF
“TransSUM/DIF” Nchg versus PT(chgjet#1) • Define “TransMAX” and “TransMIN” to be the maximum and minimum of the region 60o<Df<120o (60o<-Df<120o) on an event by event basis. The plot shows the average sum and difference of the “TransMAX” Nchg and the “TransMIN” Nchg versus PT(charged jet#1). The overall “transverse” region is the sum of “TransMAX” and “TransMIN”. • The solid (open) points are the Min-Bias (JET20) data. The errors on the (uncorrected) data include both statistical and correlated systematic uncertainties. Area DhDf 2x60o = 2p/3 “TransSUM” “TransDIF” Rick Field - Florida/CDF
“Max/Min Transverse” PTsum versus PT(chgjet#1) • Define “TransMAX” and “TransMIN” to be the maximum and minimum of the region 60o<Df<120o (60o<-Df<120o) on an event by event basis. The overall “transverse” region is the sum of “TransMAX” and “TransMIN”. The plot shows the average “TransMAX” PTsum and “TransMIN” PTsum versus PT(charged jet#1).. • The solid (open) points are the Min-Bias (JET20) data. The errors on the (uncorrected) data include both statistical and correlated systematic uncertainties. Area DhDf 2x60o = 2p/3 “TransMAX” “TransMIN” Rick Field - Florida/CDF
“TransSUM/DIF” PTsum versus PT(chgjet#1) • Define “TransMAX” and “TransMIN” to be the maximum and minimum of the region 60o<Df<120o (60o<-Df<120o) on an event by event basis. The plot shows the average sum and difference of the “TransMAX” PTsum and the “TransMIN” PTsum versus PT(charged jet#1). The overall “transverse” region is the sum of “TransMAX” and “TransMIN”. • The solid (open) points are the Min-Bias (JET20) data. The errors on the (uncorrected) data include both statistical and correlated systematic uncertainties. Area DhDf 2x60o = 2p/3 “TransSUM” “TransDIF” Rick Field - Florida/CDF
QFL: Comparing Datawith QCD Monte-Carlo Models Charged Particle And Calorimeter Data QCD Monte-Carlo • Calorimeter: tower threshold = 50 MeV, Etot < 1800 GeV, |hlj| < 0.7, |zvtx| < 60 cm, 1 and only 1 class 10, 11, or 12 vertex • Tracks: |zc-zv| < 5 cm, |CTC d0| < 0.5 cm, PT > 0.4 GeV, |h| < 1, correct for track finding efficiency Look only at both the charged particles measured by the CTC and the calorimeter data. QFL detector simulation Select region Tano-Kovacs-Huston-Bhatti compare • Require PT > 0.4 GeV, |h| < 1 Rick Field - Florida/CDF
“Transverse” Cones Tano-Kovacs-Huston-Bhatti • Sum the PT of charged particles (or the energy) in two cones of radius 0.7 at the same h as the leading jet but with |DF| = 90o. • Plot the cone with the maximum and minimum PTsum versus the ET of the leading (calorimeter) jet.. Transverse Cone: p(0.7)2=0.49p 1.36 Transverse Region: 2p/3=0.67p Rick Field - Florida/CDF
Transverse Regionsvs Transverse Cones Field-Stuart-Haas • Multiply by ratio of the areas: Max=(2.1 GeV/c)(1.36) = 2.9 GeV/c Min=(0.4 GeV/c)(1.36) = 0.5 GeV/c. • This comparison is only qualitative! 2.9 GeV/c 2.1 GeV/c 0.5 GeV/c 0 < PT(chgjet#1) < 50 GeV/c 0.4 GeV/c 50 < ET(jet#1) < 300 GeV/c Tano-Kovacs-Huston-Bhatti Can study the “underlying event” over a wide range! Rick Field - Florida/CDF
“Transverse” Nchg versus PT(chgjet#1) • Plot shows the “transverse” <Nchg> versus PT(chgjet#1) compared to the the QCD hard scattering predictions of HERWIG 5.9, ISAJET 7.32, and PYTHIA 6.115 (default parameters with PT(hard)>3 GeV/c). • Only charged particles with |h| < 1 and PT > 0.5 GeV are included and the QCD Monte-Carlo predictions have been corrected for efficiency. Isajet 7.32 Pythia 6.115 Herwig 5.9 Rick Field - Florida/CDF
“Transverse” PTsum versus PT(chgjet#1) • Plot shows the “transverse” <PTsum> versus PT(chgjet#1) compared to the the QCD hard scattering predictions of HERWIG 5.9, ISAJET 7.32, and PYTHIA 6.115 (default parameters with PT(hard)>3 GeV/c). • Only charged particles with |h| < 1 and PT > 0.5 GeV are included and the QCD Monte-Carlo predictions have been corrected for efficiency. Isajet 7.32 Pythia 6.115 Herwig 5.9 Rick Field - Florida/CDF
ISAJET: “Transverse” Nchg versus PT(chgjet#1) • Plot shows the “transverse” <Nchg> vs PT(chgjet#1) compared to the QCD hard scattering predictions of ISAJET 7.32(default parameters with PT(hard)>3 GeV/c) . • The predictions of ISAJET are divided into three categories: charged particles that arise from the break-up of the beam and target (beam-beam remnants), charged particles that arise from initial-state radiation, and charged particles that result from the outgoing jets plus final-state radiation. ISAJET Initial-State Radiation Beam-Beam Remnants Outgoing Jets Rick Field - Florida/CDF
ISAJET: “Transverse” Nchg versus PT(chgjet#1) • Plot shows the “transverse” <Nchg> vs PT(chgjet#1) compared to the QCD hard scattering predictions of ISAJET 7.32 (default parameters with PT(hard)>3 GeV/c) . • The predictions of ISAJET are divided into two categories: charged particles that arise from the break-up of the beam and target (beam-beam remnants); and charged particles that arise from the outgoing jet plus initial and final-state radiation(hard scattering component). ISAJET Outgoing Jets plus Initial & Final-State Radiation Beam-Beam Remnants Rick Field - Florida/CDF
HERWIG: “Transverse” Nchg versus PT(chgjet#1) • Plot shows the “transverse” <Nchg> vs PT(chgjet#1) compared to the QCD hard scattering predictions of HERWIG 5.9(default parameters with PT(hard)>3 GeV/c). • The predictions of HERWIG are divided into two categories: charged particles that arise from the break-up of the beam and target (beam-beam remnants); and charged particles that arise from the outgoing jet plus initial and final-state radiation(hard scattering component). HERWIG Outgoing Jets plus Initial & Final-State Radiation Beam-Beam Remnants Rick Field - Florida/CDF
PYTHIA: “Transverse” Nchg versus PT(chgjet#1) • Plot shows the “transverse” <Nchg> vs PT(chgjet#1) compared to the QCD hard scattering predictions of PYTHIA 6.115(default parameters with PT(hard)>3 GeV/c). • The predictions of PYTHIA are divided into two categories: charged particles that arise from the break-up of the beam and target (beam-beam remnants including multiple parton interactions); and charged particles that arise from the outgoing jet plus initial and final-state radiation(hard scattering component). PYTHIA Outgoing Jets plus Initial & Final-State Radiation Beam-Beam Remnants plus Multiple Parton Interactions Rick Field - Florida/CDF
Hard Scattering Component: “Transverse” Nchg vs PT(chgjet#1) • QCD hard scattering predictions of HERWIG 5.9, ISAJET 7.32, and PYTHIA 6.115. • Plot shows the “transverse” <Nchg> vs PT(chgjet#1) arising from the outgoing jets plus initial and finial-state radiation (hard scattering component). • HERWIG and PYTHIA modify the leading-log picture to include “color coherence effects” which leads to “angle ordering” within the parton shower. Angle ordering produces less high PT radiation within a parton shower. ISAJET PYTHIA HERWIG Rick Field - Florida/CDF
ISAJET: “Transverse”PT Distribution • Data on the “transverse” <Nchg> versus PT(charged jet#1) and the PT distribution of the “transverse” <Nchg>, dNchg/dPT,compared with the QCD Monte-Carlo predictions of ISAJET 7.32 (default parameters with with PT(hard) > 3 GeV/c). The integral of dNchg/dPT is the “transverse” <Nchg>. PT(charged jet#1) > 30 GeV/c “Transverse” <Nchg> = 3.7 PT(charged jet#1) > 5 GeV/c “Transverse” <Nchg> = 2.0 Rick Field - Florida/CDF
same ISAJET: “Transverse”PT Distribution • Data on the PT distribution of the “transverse” <Nchg>, dNchg/dPT,compared with the QCD Monte-Carlo predictions of ISAJET 7.32 (default parameters with with PT(hard) > 3 GeV/c). The dashed curve is the beam-beam remnant component and the solid curve is the total (beam-beam remnants plus hard component). exp(-2pT) Rick Field - Florida/CDF
HERWIG: “Transverse”PT Distribution • Data on the “transverse” <Nchg> versus PT(charged jet#1) and the PT distribution of the “transverse” <Nchg>, dNchg/dPT,compared with the QCD Monte-Carlo predictions of HERWIG 5.9 (default parameters with with PT(hard) > 3 GeV/c). The integral of dNchg/dPT is the “transverse” <Nchg>. PT(charged jet#1) > 30 GeV/c “Transverse” <Nchg> = 2.2 PT(charged jet#1) > 5 GeV/c “Transverse” <Nchg> = 1.7 Rick Field - Florida/CDF
HERWIG: “Transverse”PT Distribution • Data on the PT distribution of the “transverse” <Nchg>, dNchg/dPT,compared with the QCD Monte-Carlo predictions of HERWIG 5.9 (default parameters with with PT(hard) > 3 GeV/c). The dashed curve is the beam-beam remnant component and the solid curve is the total (beam-beam remnants plus hard component). exp(-2pT) same Rick Field - Florida/CDF
PYTHIA: “Transverse”PT Distribution • Data on the “transverse” <Nchg> versus PT(charged jet#1) and the PT distribution of the “transverse” <Nchg>, dNchg/dPT,compared with the QCD Monte-Carlo predictions of PYTHIA 6.115 (default parameters with with PT(hard) > 3 GeV/c). The integral of dNchg/dPT is the “transverse” <Nchg>. Includes Multiple Parton Interactions PT(charged jet#1) > 30 GeV/c “Transverse” <Nchg> = 2.9 PT(charged jet#1) > 5 GeV/c “Transverse” <Nchg> = 2.3 Rick Field - Florida/CDF
PYTHIA: Multiple PartonInteractions Pythia uses multiple parton interactions to enhace the underlying event. and new HERWIG! Multiple parton interaction more likely in a hard (central) collision! Hard Core Rick Field - Florida/CDF
PYTHIAMultiple Parton Interactions PYTHIA default parameters • Plot shows “Transverse” <Nchg> versus PT(chgjet#1) compared to the QCD hard scattering predictions of PYTHIA with PT(hard) > 3 GeV. • PYTHIA 6.115: GRV94L, MSTP(82)=1, PTmin=PARP(81)=1.4 GeV/c. • PYTHIA 6.125: GRV94L, MSTP(82)=1, PTmin=PARP(81)=1.9 GeV/c. • PYTHIA 6.115: GRV94L, MSTP(81)=0, no multiple parton interactions. 6.115 6.125 No multiple scattering Constant Probability Scattering Rick Field - Florida/CDF
PYTHIAMultiple Parton Interactions • Plot shows “transverse” <Nchg> versus PT(chgjet#1) compared to the QCD hard scattering predictions of PYTHIA with PT(hard) > 0 GeV/c. • PYTHIA 6.115: GRV94L, MSTP(82)=1, PTmin=PARP(81)=1.4 GeV/c. • PYTHIA 6.115: CTEQ3L, MSTP(82)=1, PTmin=PARP(81)=1.4 GeV/c. • PYTHIA 6.115: CTEQ3L, MSTP(82)=1, PTmin=PARP(81)=0.9 GeV/c. Note: Multiple parton interactions depend sensitively on the PDF’s! Constant Probability Scattering Rick Field - Florida/CDF
PYTHIAMultiple Parton Interactions • Plot shows “transverse” <Nchg> versus PT(chgjet#1) compared to the QCD hard scattering predictions of PYTHIA with PT(hard) > 0 GeV/c. • PYTHIA 6.115: GRV94L, MSTP(82)=3, PT0=PARP(82)=1.55 GeV/c. • PYTHIA 6.115: CTEQ3L, MSTP(82)=3, PT0=PARP(82)=1.55 GeV/c. • PYTHIA 6.115: CTEQ3L, MSTP(82)=3, PT0=PARP(82)=1.35 GeV/c. • PYTHIA 6.115: CTEQ4L, MSTP(82)=3, PT0=PARP(82)=1.8 GeV/c. Note: Multiple parton interactions depend sensitively on the PDF’s! Varying Impact Parameter Rick Field - Florida/CDF
PYTHIAMultiple Parton Interactions • Plot shows “transverse” <Nchg> versus PT(chgjet#1) compared to the QCD hard scattering predictions of PYTHIA with PT(hard) > 0 GeV/c. • PYTHIA 6.115: CTEQ4L, MSTP(82)=4, PT0=PARP(82)=1.55 GeV/c. • PYTHIA 6.115: CTEQ3L, MSTP(82)=4, PT0=PARP(82)=1.55 GeV/c. • PYTHIA 6.115: CTEQ4L, MSTP(82)=4, PT0=PARP(82)=2.4 GeV/c. Note: Multiple parton interactions depend sensitively on the PDF’s! Varying Impact Parameter Hard Core Rick Field - Florida/CDF
Tuned PYTHIA: “Transverse” Nchg vs PT(chgjet#1) • Plot shows “transverse” <Nchg> versus PT(chgjet#1) compared to the QCD hard scattering predictions of PYTHIA with PT(hard) > 0 GeV/c. • PYTHIA 6.115: CTEQ4L, MSTP(82)=3, PT0=PARP(82)=1.8 GeV/c. • PYTHIA 6.115: CTEQ4L, MSTP(82)=4, PT0=PARP(82)=2.4 GeV/c. Describes correctly the rise from soft-collisions to hard-collisions! Varying Impact Parameter Rick Field - Florida/CDF
Tuned PYTHIA:“Transverse” PTsum vs PT(chgjet#1) • Plot shows “transverse” <PTsum> versus PT(chgjet#1) compared to the QCD hard scattering predictions of PYTHIA with PT(hard) > 0 GeV. • PYTHIA 6.115: CTEQ4L, MSTP(82)=3, PT0=PARP(82)=1.8 GeV/c. • PYTHIA 6.115: CTEQ4L, MSTP(82)=4, PT0=PARP(82)=2.4 GeV/c. Describes correctly the rise from soft-collisions to hard-collisions! Varying Impact Parameter Rick Field - Florida/CDF
Tuned PYTHIA:“Transverse” PT Distribution • Data on the “transverse” <Nchg> versus PT(charged jet#1) and the PT distribution of the “transverse” <Nchg>, dNchg/dPT,compared with the QCD Monte-Carlo predictions of PYTHIA 6.115 with PT(hard) > 0 GeV/c, CTEQ4L, MSTP(82)=4, PT0=PARP(82)=2.4 GeV/c. The integral of dNchg/dPT is the “transverse” <Nchg>. Includes Multiple Parton Interactions PT(charged jet#1) > 30 GeV/c “Transverse” <Nchg> = 2.7 PT(charged jet#1) > 5 GeV/c “Transverse” <Nchg> = 2.3 Rick Field - Florida/CDF
Tuned PYTHIA:“Transverse” PT Distribution • Data on the PT distribution of the “transverse” <Nchg>, dNchg/dPT,compared with the QCD Monte-Carlo predictions of PYTHIA 6.115 with PT(hard) > 0, CTEQ4L, MSTP(82)=4, PT0=PARP(82)=2.4 GeV/c. The dashed curve is the beam-beam remnant component and the solid curve is the total (beam-beam remnants plus hard component). Includes Multiple Parton Interactions Rick Field - Florida/CDF
Tuned PYTHIA:“TransMAX/MIN” vs PT(chgjet#1) • Plots shows data on the “transMAX/MIN” <Nchg> and “transMAX/MIN” <PTsum> vs PT(chgjet#1). The solid (open) points are the Min-Bias (JET20) data. • The data are compared with the QCD Monte-Carlo predictions of PYTHIA 6.115 with PT(hard) > 0, CTEQ4L, MSTP(82)=4, PT0=PARP(82)=2.4 GeV/c. <Nchg> <PTsum> Rick Field - Florida/CDF
Tuned PYTHIA:“TransSUM/DIF” vs PT(chgjet#1) • Plots shows data on the “transSUM/DIF” <Nchg> and “transSUM/DIF” <PTsum> vs PT(chgjet#1). The solid (open) points are the Min-Bias (JET20) data. • The data are compared with the QCD Monte-Carlo predictions of PYTHIA 6.115 with PT(hard) > 0, CTEQ4L, MSTP(82)=4, PT0=PARP(82)=2.4 GeV/c. <Nchg> <PTsum> Rick Field - Florida/CDF
Tuned PYTHIA:“TransMAX/MIN” vs PT(chgjet#1) • Data on the “transMAX/MIN” Nchg vs PT(chgjet#1) comared with the QCD Monte-Carlo predictions of PYTHIA 6.115 with PT(hard) > 0, CTEQ4L, MSTP(82)=4, PT0=PARP(82)=2.4 GeV/c. • The predictions of PYTHIA are divided into two categories: charged particles that arise from the break-up of the beam and target (beam-beam remnants); and charged particles that arise from the outgoing jets plus initial and final-state radiation (hard scattering component). “TransMAX” <Nchg> “TransMIN” <Nchg> Includes Multiple Parton Interactions Rick Field - Florida/CDF
Tuned PYTHIA:“TransSUM/DIF” vs PT(chgjet#1) • Data on the “transSUM/DIF” Nchg vs PT(chgjet#1) comared with the QCD Monte-Carlo predictions of PYTHIA 6.115 with PT(hard) > 0, CTEQ4L, MSTP(82)=4, PT0=PARP(82)=2.4 GeV/c. • The predictions of PYTHIA are divided into two categories: charged particles that arise from the break-up of the beam and target (beam-beam remnants); and charged particles that arise from the outgoing jet plus initial and final-state radiation (hard scattering component). “TransSUM” <Nchg> “TransDIF” <Nchg> Includes Multiple Parton Interactions Rick Field - Florida/CDF
The Underlying Event:Summary & Conclusions • Combining the two CDF analyses gives a quantitative study of the underlying event from very soft collisions to very hard collisions. • ISAJET (with independent fragmentation) produces too many (soft) particles in the underlying event with the wrong dependence on PT(jet#1). HERWIG and PYTHIA modify the leading-log picture to include “color coherence effects” which leads to “angle ordering” within the parton shower and do a better job describing the underlying event. • Both ISAJET and HERWIG have the too steep of a PT dependence of the beam-beam remnant component of the underlying event and hence do not have enough beam-beam remnants with PT > 0.5 GeV/c. • PYTHIA (with multiple parton interactions) does the best job in describing the underlying event. • Perhaps the multiple parton interaction approach is correct or maybe we simply need to improve the way the Monte-Carlo models handle the beam-beam remnants (or both!). The “Underlying Event” Rick Field - Florida/CDF
Multiple Parton Interactions:Summary & Conclusions • The increased activity in the underlying event in a hard scattering over a soft collision cannot be explained by initial-state radiation. • Multiple parton interactions gives a natural way of explaining the increased activity in the underlying event in a hard scattering. A hard scattering is more likely to occur when the hard cores overlap and this is also when the probability of a multiple parton interaction is greatest. For a soft grazing collision the probability of a multiple parton interaction is small. • PYTHIA (with varying impact parameter) describes the underlying event data fairly well. However, there are problems in fitting min-bias events with this approach. • Multiple parton interactions are very sensitive to the parton structure functions. You must first decide on a particular PDF and then tune the multiple parton interactions to fit the data. Multiple Parton Interactions Proton AntiProton Hard Core Hard Core Slow! Rick Field - Florida/CDF