Download
1 / 23
240 likes | 260 Views
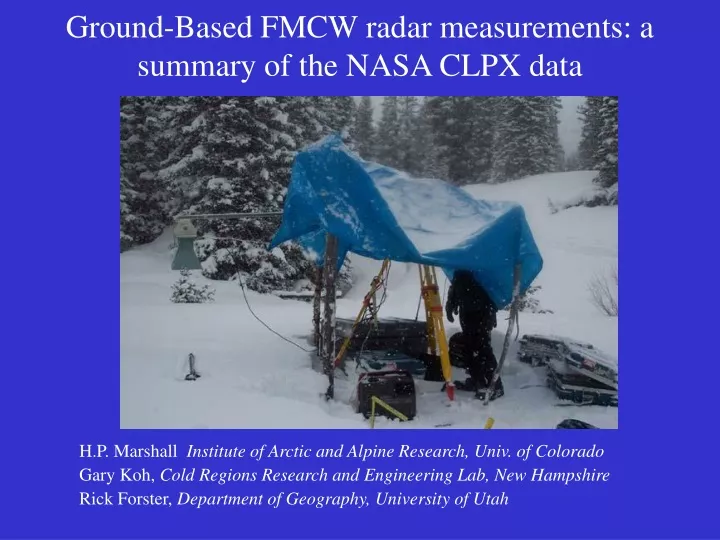
Summary of FMCW radar data from NASA's Cold Land Processes Field Experiment, covering theory, signal processing, calibration, and data analysis for snowpack studies.

E N D
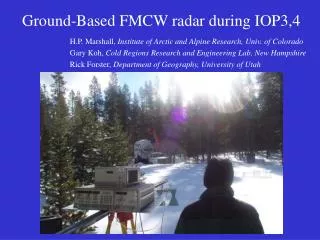
H.P. Marshall Institute of Arctic and Alpine Research, Univ. of Colorado Gary Koh, Cold Regions Research and Engineering Lab, New Hampshire Rick Forster, Department of Geography, University of Utah Ground-Based FMCW radar measurements: a summary of the NASA CLPX data
Linear frequency chirp transmitted (T) Received signal (R) “mixed” with transmitted wave before signal acquisition Recorded signal contains the sum and difference frequencies from T + R Frequency differences from reflectors linearly related to the distance to target Brief FMCW Theory II
Windowed FFT, zero-padded, normalized by DC-coupling, power from surface calibration
Filter instrumentation-related signals • Locations where mean of signal > 5x mean deviation found • Mean trace at these depths subtracted from scan
Depth Calibration • Metal reflectors placed at known depths • Accurate depth scale, will also be used to calculate attenuation
LSOS Feb 19, 2002, C-Band: 2-6 GHz DRY SNOWPACK
LSOS Feb 19, 2002, X-Band: 8-12 GHz DRY SNOWPACK
LSOS Feb 19, 2002, Ku-Band: 14-18 GHz DRY SNOWPACK
LSOS March 26, 2002, C-Band: 2-6 GHz WET SNOWPACK
LSOS March 26, 2002, X-Band: 8-12 GHz WET SNOWPACK
LSOS March 26, 2002, Ku-Band: 14-18 GHz WET SNOWPACK
FMCW signal strongly related to in-situ dielectric measurements Resolution highest at Ku-Band, but little penetration if wet Incidence angle measurements indicate surface scattering dominates below ~15 deg and volume scattering above 30 Preliminary comparison with FMCW measurements at more narrow bandwidths encouraging Conclusions
Acknowledgements NASA Earth System Science Fellowship CRREL Kelly Elder, Don Cline Nate Mullheren