Download
1 / 46
460 likes | 586 Views
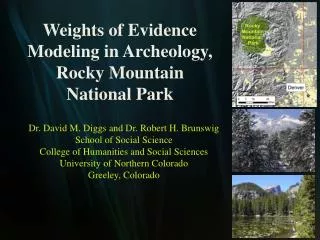
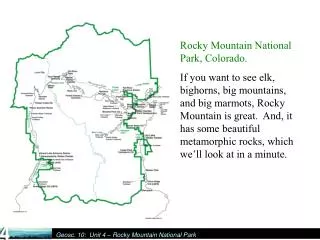
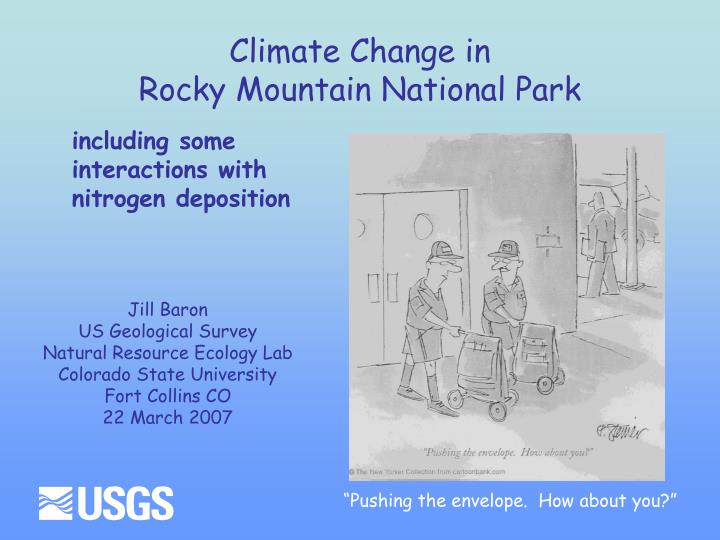
Climate Change in Rocky Mountain National Park. including some interactions with nitrogen deposition. Jill Baron US Geological Survey Natural Resource Ecology Lab Colorado State University Fort Collins CO 22 March 2007. “Pushing the envelope. How about you?”.

E N D
Climate Change in Rocky Mountain National Park including some interactions with nitrogen deposition Jill Baron US Geological Survey Natural Resource Ecology Lab Colorado State University Fort Collins CO 22 March 2007 “Pushing the envelope. How about you?”
Western Climate is Warming Temperatures warm more rapidly after 1950 Precipitation? Variable Mote et al. 2003 (taken from Udall, WWA)
Daily Temperatures Are Increasing For Tmin & Tmax, difference in monthly means from 1996 to 2005, versus historical averages (Yellowstone area) Clow et al. 2003 Saunders et al. 2006
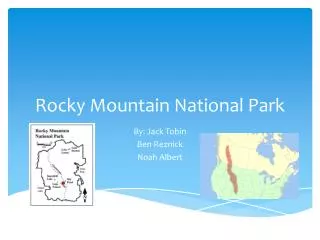
Local temperature trends Elevations Niwot D1 3743 m Grand 2274 m Boulder 1672 m Larimer 1525 m
We are seeing record-breaking extremes Record-breaking high March temps, lack of precipitation in 100 yr record Record-setting peak snowmelt Pagano et al. 2004, EOS
Under various greenhouse forcings Climate models yield 1. fairly narrow range of warming scenarios and (amidst a broad overall range) 2. tendency for little precipitation change in California and most of the West. 20 of 23 in this range 19 of 23 in this range cm/month cm/month Dettinger, 2005
Observed Changes in Climate • Warming • Erratic precipitation • Extreme drought • Extreme storms (Mount Rainier) • More warming projected So what??!!
Earlier snowmelt runoff Stewart et al., 2005 Less spring snowpack Mote, 2003 Earlier onset of spring snowmelt & less snowpack Snow season 16 days shorter in CA & NV (1951-1996)
-2.2 std devs LESS as snowfall +1 std dev MORE as snowfall Warming significant hydroclimatic changes Less snow/more rain Earlier greenup TRENDS (1954-94) in Lilac first-bloom dates Cayan et al., 2001 Knowles et al., 2006
The Glacier Next Door Boulder Daily Camera
Less vulnerable More vulnerable “Duration of Snowpack” Where will the largest (snowmelt) temperature effects occur? How many days/year historically were just below freezing? Computed from UW’s VIC model daily INPUTS (Bales et al, in press)
Expected changes in FROZEN-SEASON LENGTH 30-60 days/year less in 2050 for ROMO 2025 Derived from monthly IPCC GCM-grid pdfs, and UW’s VIC model daily inputs, 1950-1999 2050
Large wildfires increased suddenly and dramatically in mid-1980s in West • More large wildfires • Longer wildfire durations • Longer wildfire seasons • Strongly associated with increased spring and summer temperatures and earlier spring snowmelt Westerling et al. 2006
Larger fires with drier, warmer climates Climate is trending warmer COLORADO 0 % Precip 0 Temp °C McKenzie et al. 2004
Climate Change, Wildfire, and Conservation “If longer, more severe fire seasons are indeed an outcome of climate warming, the probability of losing local populations of species that depend on late seral habitat will increase. …contemporary landscapes have been altered by timber extraction, agriculture, and human settlements. Options for suitable postfire habitat have been reduced, creating the potential for severe “bottlenecks” in space and time, particularly for species that have narrow habitat requirements, restricted distributions, or low mobility.” McKenzie et al. 2004, Cons Biol.
Observed Changes in Wildlife at Gothic, CO Marmots emerging 38 days earlier than in 1977 Robins arriving 14 days earlier Inouye et al. PNAS 2000
Some flowering plants strongly linked to snowpack Dwarf Larkspur Photo::Daniel Mosquin Saavedra et al. GCB, 2003
Grinnell Resurvey, YOSE • Trapping 1914, 2002-2005 • Four new species moved into YOSE • Four species have contracted their ranges • Several species have shifted ranges up to 2000 m higher • One species extirpated
Ptarmigan model results under climate scenarios Ptarmigan on Thatchtop August 2005
Some Species Like it Warmer! • Elk (Wang et al. 2002) • Pine Bark Beetle (Hicke et al. 2006) • Cutthroat trout (Cooney 2003) • Whirling Disease (Covich and Cooney 2003) • West Nile Virus (CDC)
Greenback Cutthroat Trout The endangered Greenback Cutthroat Trout require water temperatures above 5 °C to successfully spawn and 472 growing degree days for young trout to be able to overwinter
Other changes that could occur (besides earlier snowmelt, more wildfire): 1. Increased insects and disease 2. Narrowing of tundra regions, reduction of obligate tundra spp. habitat 3. Synergies with air pollution 4. More visitors 5. More elk 6. More cutthroat trout habitat, but also more potential for whirling disease
Climate Change and Atmospheric Nitrogen Deposition Synergies and Antagonisms
NO3 NH4 NOx NO NO2 NH3 NOx NH3
CH4 N2O CO2 NO3 NH4 NOx NO NO2 NH3 NOx NH3
N Deposition Fertilization Loss of Soil Buffering Changes in Plant Communities N Saturation Lake Eutrophication Changes in Aquatic Species Loss of Lake ANC (acidification) Pathways and Effects of Excess Nitrogen Deposition
NOx SO2 Assessing ecological and biogeochemical responses to changing atmospheric nitrogen and sulfur depositionand climate for diverse ecosystems 1 Natural Resource Ecology Laboratory, Colorado State University, Fort Collins, CO 2 USGS Melannie Hartman1, Jill Baron1,2, Dennis Ojima 1
Great Smoky NP (GRSM) Noland Divide Mount Rainier NP (MORA) Lake Louise Niwot Ridge (NWT) Green Lakes Valley Coweeta (CWT) WS 2 HJ Andrews (HJA) WS 10 (clear cut 1975) Hubbard Brook (HBR) WS 6
Methods • Calibrated DayCent-Chem on a subset of years with measurements (Q, stream & soil chemistry, NPP, mineralization, SOM) • Pre-scenario: ~1980-2000 • drivers: measured meteorology, NADP, CASTNet • Scenario: 2001-2050 with future climate and N,S deposition
Deposition Scenarios • CMAQmodeling system (U.S. EPA COMMUNITY MULTISCALE AIR QUALITY). • wet and dry amounts N and S species • 2001 Base case • 2010, 2015, 2020 CAIR (Clean Air Interstate Rule) • Linearly interpolate for years in between • Each day: annual deposition / 365 Climate Scenarios • MM5(Penn State/NCAR Mesoscale Model) • 1976-2075 daily climate (lat, lon). • no trend in precipitation for most sites • +0.02-0.03 °C/year
The climate scenarios for Niwot Ridge Change from 85% to ~60% snow
Stream chemistry responses to N, climate change
Interactions of climate change and nitrogen deposition • Higher elevations likely to see longer, warmer, growing seasons: more N uptake, greater plant productivity • Shifts in communities (Walker et al. 2006) • Less N leaching to aquatic systems (Baron and Hartman 2002, Hartman et al. in prep) • More productivity, more fuel (Fenn et al. 2003) • More N content in leaves, more palatable to insects (Fenn et al 2003 • N promotes carbon (and N2O?) loss in peat bogs (Bragazza et al. 2006)
Interactions of climate change and nitrogen deposition • Lower elevations likely to see effective drought • Lakes and streams receive less N (Schindler et al. 1996) • Warming, drought, and acid change food web structure (algae, zooplankton switched to stress-tolerant species; Christensen et al. 2006) • Storms can cause high N pulses into waters (Fenn et al. 1996)
Summary • Climate change trends already apparent • Ecological responses range fromsimple • Phenology, migration, extirpation tocomplex • Interactions of climate, fire, snowmelt, snowpack with habitat, species, diseases, pests • Interactions with nitrogen appear subtle
What to do? Time to make a plan