Download
1 / 34
340 likes | 359 Views
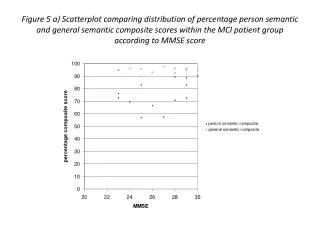
Explore the rationale for composite scores, usefulness of z-scores, and implications for cognitive testing. Learn how z-scores facilitate communication and interpretation in clinical practice. Discover the value of composite scores in cognitive assessments.

E N D
Composite scores Paul K. Crane, MD MPH Dan M. Mungas, PhD
Disclaimer • Funding for this conference was made possible, in part by Grant R13 AG030995 from the National Institute on Aging. • The views expressed do not necessarily reflect the official policies of the Department of Health and Human Services; nor does mention by trade names, commercial practices, or organizations imply endorsement by the U.S. Government. • Drs. Harvey and Crane have no conflicts of interest to report.
Outline • Neuropsychological practice and the utility of z scores • Why composite scores? Drinking from the fire hose • Z scores head to head with IRT scores • Conclusions
Neuropsychological practice • Often focused on patterns of cognitive deficits across different domains • Useful in differential diagnosis of the cognitively impaired individual • May emphasize a premorbid estimate of ability • Multiple determinants, including occupation, educational attainment, military rank (for vets) • Vocabulary preserved in early AD, so it may be used as well
Scores and communication • Neuropsychological batteries contain many tests, each with a different scoring metric • Familiarity permits experts to understand what a Mattis score of 130 and 4 errors on the Clock and a Trails B time of 142 seconds imply about the examinee’s cognitive functioning • Difficult to communicate these scores to less experienced colleagues
Clinical use of z scores • Z scores facilitate short-hand communication • Relatively easy to calculate • Requires some average score and some standard deviation to calculate; age-specific or race-specific or education-specific norms? • May not matter much within an individual, unless different tests have much different demographic impacts • Makes it much easier for individuals with less experience with the tests to identify domains with deficits
Rationale for composite scores • Summary scores are very helpful for analyses • Better measurement properties together than any instrument on its own • Avoid problems from multiple hypotheses • True signal scenario with multiple bad tests: a few show p<0.05, a few don’t, looks like the work of chance • True signal scenario with one good test: may work • Depends on measurement properties, and whether the items pooled together measure the thing intended (dimensionality and validity issues)
Logical next step in the z score story • Very simple extension to average the z scores of the tests within a domain and use that average z score in analyses • Commonly done, even considered relatively sophisticated by study sections in 2008 • But: may not be the best thing to do from a psychometrics perspective
Assumptions of z scores • Each item / scale / test has equal weight on the overall score • Is letter fluency with 3 letters 1 test or 3 tests? This matters (1/n influence on total score, or 3/n influence on total score) • The scale determined by the standard deviation • Highly variable items / scales / tests are weighted less • Less variable items / scales / tests are weighted more • Is this what we would want? • Wouldn’t we want to incorporate information about the relative difficulty of different tests?
Linearity • Hidden in z scores is an assumption that 1 SD difference in scores has the same meaning related to underlying domain measured by the test in all regions (Usually “ability” for neuropsychological tests) • A z score is a transformed sum score • Tests constructed without modern psychometrics tend to have a common structure: most of the items are in the middle
Curvilinearity in a longitudinal study • Where you start on the curve matters a great deal in how much change there appears to be
Linear scaling 1 Low ability High ability
Linear scaling 2 High ability (difficult items) Low ability (easy items) XXXXXXXXX XXXX XXXXX XX
Linear scaling 3 Low ability High ability XXXXXXXXX XXXX XXXXX XX B0 A0
Linear scaling 4 Low ability High ability XXXXXXXXX XXXX XXXXX XX B0 A1 B1 A0
Linear scaling 5 Low ability High ability XXXXXXXXX XXXX XXXXX XX B0 A1 B1 A0 11 “at risk” points 1 “at risk” point
Linear scaling 6 Low ability High ability XXXXXXXXX XXXX XXXXX XX +2 -2… -1 +1 0 …+3 Mean=7, SD=5
Same example with a different population Low ability High ability XXXXXXXXX XXXX XXXXX XX -6 -5-4-3-2-1 0 +1 +2 +3 Mean=13, SD=2
Same issue with Fluency • Let’s say in a population the mean of /F/ is 12 in 1 minute, SD 3 • Using a z score implies difference in implication between 3 and 6 words is the same as the difference in implication between 33 and 36 words (1 SD unit difference) • 3: really awful. 6: pretty bad. • 33 and 36: both really good. Certainly 33 and 36 not qualitatively as different as 3 and 6 are • Similarly, difference between 3 and 12 (awful and average) is the same as between 36 and 45 (really good and superb) (3 SD units)
Zero in z scores • Average score is 0 for each test • Weights for scores different from 0 determined by the variability (in the form of the SD), not the relative difficulty of the test • Is this what we would want?
Summary: issues with z scores • Dimensionality: Should we lump these items / scales / tests together? • Equal weighting: Should each item / scale / test receive equal weight in the overall composite score? • Scales based on variability: Is it appropriate to base the scale on the observed SD in the population? • Equal difficulty: Are all of the items / scales / tests equally difficult? • Linearity: Is the relationship with the underlying construct measured by the test the same across the entire spectrum?
Z scores vs. IRT scores • IRT scores offer more flexibility; linear scaling • Weighting based on relative difficulties of different tests • (Different handling of demographic heterogeneity) • Facilitates specific attention to measurement error / precision
2 head to head studies: Study 1 • FH 2005, in press at JINS • Executive functioning battery added to SENAS • Subset had MRI evaluations • Compared IRT to z scores head to head in terms of strength of relationship with neuroimaging parameters • Demographic heterogeneity
Ability … … i i i i 1 n n+1 n+m Demographics Items Items with without DIF DIF Composite Score MRI Conceptual model
Findings • Strength of relationship of executive functioning composite with MRI was similar for IRT scores as for composite z score • Accounting for heterogeneity in ages using adjusted z scores decreased strength of relationship • Accounting for ethnicity / language, education, and gender did not impair strength of relationship • Accounting for heterogeneity using IRT and DIF did not impact strength of relationship
Study 2 • Convenience sample with three known groups: AD, impaired cognition with no dementia, and normal cognition • Neuropsychological battery administered, including several measures of executive functioning
Digits backwards from the CASI • I think it’s items in the CASI • How to score these items? (not clear) • Does it matter? (absolutely)
Digits backwards Score 1: more credit for 4 digits than 3 digits Score 2: equal credit for 4 digits and 3 digits Score 3: more credit for 4 digits than 3 digits, lots of points for both Score 4: more credit for 4 digits than 3 digits, LOTS of points for both
Digits backwards Score 1: more credit for 4 digits than 3 digits Score 2: equal credit for 4 digits and 3 digits Score 3: more credit for 4 digits than 3 digits, lots of points for both Score 4: more credit for 4 digits than 3 digits, LOTS of points for both
Strength of relationship with cognitive impairment IRT scores were at least as good as z scores Demographic adjustment in the z score framework was a bad idea Demographic adjustment in the IRT framework was not as bad an idea
Conclusions • Many theoretical reasons latent trait scores (such as IRT) would be preferred to classical test theory scores (such as z scores) • Here 2 specific examples of relative validity of executive functioning composites • Theoretically and practically better approach to demographic heterogeneity