Download
1 / 27
270 likes | 464 Views
Soil C Dynamics Following Addition of 13 C-labeled Grain Sorghum ( Sorghum bicolor ) Residue. Paul White and Dr. Charles W. Rice Department of Agronomy Kansas State University Manhattan, KS. Carbon Sequestration. Atmospheric CO 2 levels have increased from 260 to 370 ppmv (IPPC, 2004).

E N D
Soil C Dynamics Following Addition of 13C-labeled Grain Sorghum (Sorghum bicolor) Residue Paul White and Dr. Charles W. Rice Department of Agronomy Kansas State University Manhattan, KS
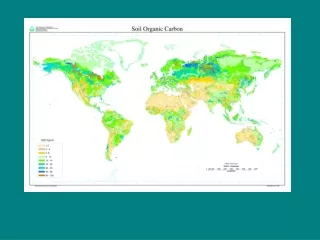
Carbon Sequestration • Atmospheric CO2 levels have increased from 260 to 370 ppmv (IPPC, 2004). • Increasing soil C storage may assist in offsetting increases in CO2 due to fossil fuel emissions until cleaner fuel technology is available on a large scale. • Understanding dynamics of C flow in differently managed ecosystems will be important to forecast C-sequestration effectiveness and extent. • Possible manipulation of ecosystem to increase soil C storage potential
Sunlight Temperature Moisture Nutrients CO2 Inputs Outputs Substrate Quality Soil Belowground Biology
Readily decomposable Moderately decomposable Resistant INPUTS Plant residue CO2 CO2 CO2 Microbial Biomass C Plant and microbial byproducts CO2 = OUTPUTS CO2 CO2 Slow soil C Stable soil C Temporal C changes in soil aggregates? Changes in microbial community dynamics? Adapted from Paul and Clark, 1996
Objectives During one growing season: • Measure the mineralization of 13C-labeled plant residue • Measure the changes in soil TC and TN • Measure the changes in soil TC and 13C in macro- and microaggregates • Determine microbial community changes in response to added residue
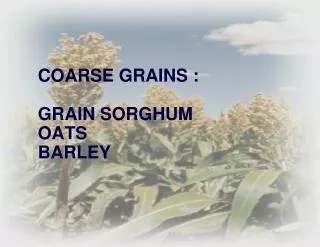
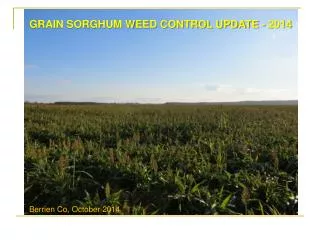
Ashland Experimental Farm, Manhattan, KS Field Microcosm Experiment • Continuous Sorghum under No-Tillage (NT) and Conventional Tillage (CT) • 4 Blocks • 2 Residue Levels: Control (no residue) and 0.5% by weight • 7 Sample Times: 0, 3, 16, 25, 40, 68, and 159 d • Data analyzed using SAS v9 Proc Mixed and means separated at the 5% significance level (SAS Institute, Cary N.C).
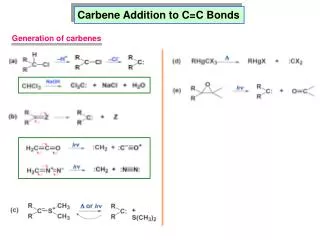
Materials and Methods Sorghum bicolor CV: Mycogen 1506 0.5X Hoagland’s Pulse labeled 5X with 100% 13CO2 Pre-boot stage (about 65 d) Above ground material removed, freeze dried, shredded, and the 4 to 6 mm fraction retained for field experiment Aboveground Residue Characteristics Total C 13C (PDB) ----%---- -----‰----- 42 570
Materials and Methods NT 2.1 g 13C labeled residue placed on soil surface 20 cm deep by 5 cm diameter PVC cores 15 cm CT 2.1 g Mixed evenly with upper 15 cm soil with soil Anion and Cation Exchange Resin bag
Materials and Methods Sample Times: 0 3 16 25 40 68 159d 0 cm Soil separated into 0-5 and 5-15 cm sections and sieved (4 mm) and either air-dried, put in 4 °C cooler, or freeze dried depending on analysis. 5 cm 15 cm Anion and Cation Exchange Resin bag
Materials and Methods C measurements on a scaled approach Total % C and N 13C Whole Soil 13C Aggregates (>1000 m, 250-1000 m, 53-250 m, and 20-53 m) Phospholipid Fatty Acids Neutral Lipid Fatty Acids Overall system stability New input decomposition and retention Temporal C changes in aggregates? Changes in microbial community structure?
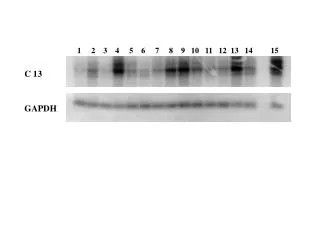
Materials and Methods Total % soil C, N by dry combustion & TCD detection 13C whole soil measured by conversion to CO2 using dry combustion and isotopic 13C measured using Europa 20-20 IRMS. 13C Data reported relative to the Pee Dee Belemnite (1.12372% 13C, or 0‰)
Soil: Muir silt loam Tillage Depth pH P Ca K Mg Na SO4-S NH4-N NO3-N TC TN 1:1 -----------------------mg/kg------------------------ ----%---- CT0-5 5.4 128 1844 317 281 3.6 7.5 3.6 8.2 1.2 0.11 CT5-15 5.7 52 2209 193 308 6.0 7.6 2.8 3.4 1.2 0.11 NT0-5 5.0 158 1768 262 251 3.7 8.3 2.9 5.4 1.9 0.17 NT5-15 5.8 41 2201 173 291 5.8 6.5 2.5 2.4 1.4 0.13 Bulk Density: NT=1.40 g/cm3 CT=1.36 g/cm3 (G. Doyle, Ph.D. Dissertation) Data reported on a Mg/ha to 15 cm depth basis
2004 Precipitation Sample Times:
2004 Temperature 2004 Air Temperature 1980-2003 Air Temp
Time=2 Soil C Time=1 Soil C b 60 50 60 a a 40 50 Time=0 Soil C a MgC/ha 30 40 b 20 MgC/ha 30 a 60 10 20 a a 50 0 10 0-5 5-15 0-5 5-15 40 0 0-5 5-15 0-5 5-15 MgC/ha 30 CT CT NT NT 20 CT CT NT NT Treatment 10 Treatment 0 0-5 5-15 0-5 5-15 Time=4 Soil C CT CT NT NT Time=3 Soil C Treatment 60 50 60 40 50 MgC/ha 30 40 20 MgC/ha 30 10 20 0 10 0-5 5-15 0-5 5-15 0 0-5 5-15 0-5 5-15 CT CT NT NT CT CT NT NT Treatment Time=6 Soil C Treatment 60 50 40 MgC/ha 30 20 10 Time=5 Soil C 0 0-5 5-15 0-5 5-15 60 CT CT NT NT 50 Treatment 40 MgC/ha 30 Treatment 20 10 0 0-5 5-15 0-5 5-15 CT CT NT NT Total Soil C –Tillage X Depth Interaction
Time=1 Soil N 5 Time=2 Soil N T=0 Soil N 4 3 5 5 MgN/ha 2 4 4 1 3 3 MgN/ha MgN/ha 0 2 2 0-5 5-15 0-5 5-15 1 1 CT CT NT NT 0 0 0-5 5-15 0-5 5-15 Treatment 0-5 5-15 0-5 5-15 CT CT NT NT CT CT NT NT Treatment Treatment Time=3 Soil N Time=4 Soil N 5 5 4 4 3 3 MgN/ha MgN/ha 2 2 1 1 0 0 0-5 5-15 0-5 5-15 0-5 5-15 0-5 5-15 Time=6 Soil N CT CT NT NT CT CT NT NT Treatment Treatment 5 4 Time=5 Soil N 3 MgN/ha 2 5 1 4 0 3 0-5 5-15 0-5 5-15 MgN/ha 2 CT CT NT NT 1 Treatment 0 0-5 5-15 0-5 5-15 CT CT NT NT Treatment Total Soil N –Tillage X Depth Interaction
Kinetics modeled as first order having a rapid and slow phase according to: Ct=Co-ekt CT 0-5 13C remaining during experiment 6 5.5 CT0-5block1 ln100+13C CT0-5block2 CT0-5block3 CT0-5block4 5 4.5 0 10 20 30 40 50 60 70 80 Time (d)
By T=5, no significant difference between tillage or depth in remaining total amount of 13C in soil: 0-15 cm average 13C --------‰ (PDB)-------- CT +28.66 NT +34.63 Rapid Slow ---------k/day------------ -0.0316 -0.0024 Residue Decomposition Kinetics
Conclusions • Addition of 0.5% by weight grain sorghum residue did not have significant impacts on soil C and N dynamics during the growing season Indicating relative macro system stability • Decomposition kinetics and residual 13C levels were not different between tillage regimes Label detectable throughout growing season • 13C Aggregate analysis and microbial lipids analysis may indicate management effects at a finer resolution
Acknowledgments • Geronimo Watson, Karina Fabrizzi, Jamey Duesterhaus, and undergraduate lab techs • Dr. Chuck Rice • Dr. Mary-Beth Kirkham • Dr. Clenton Owensby • Dr. Dallas Pederson This material is based upon work supported by the Cooperative State Research, Education, and Extension Service, U.S. Department of Agriculture, Under Agreement No. 2001-38700-11092.