Download
1 / 1

E N D
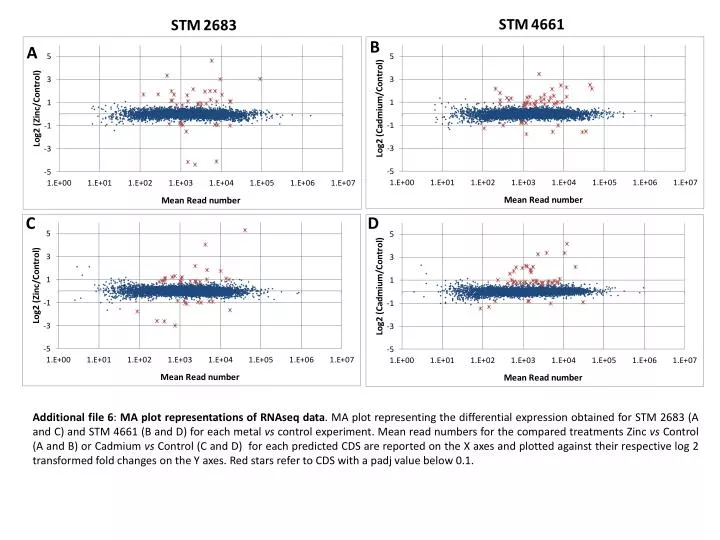
Additional file 6: MA plot representations of RNAseq data. MA plot representing the differential expression obtained for STM 2683 (A and C) and STM 4661 (B and D) for each metal vs control experiment. Mean read numbers for the compared treatments Zinc vsControl (A and B) or Cadmium vs Control (C and D) for each predicted CDS are reported on the X axes and plotted against their respective log 2 transformed fold changes on the Y axes. Red stars refer to CDS with a padj value below 0.1.