Download
1 / 62
620 likes | 735 Views
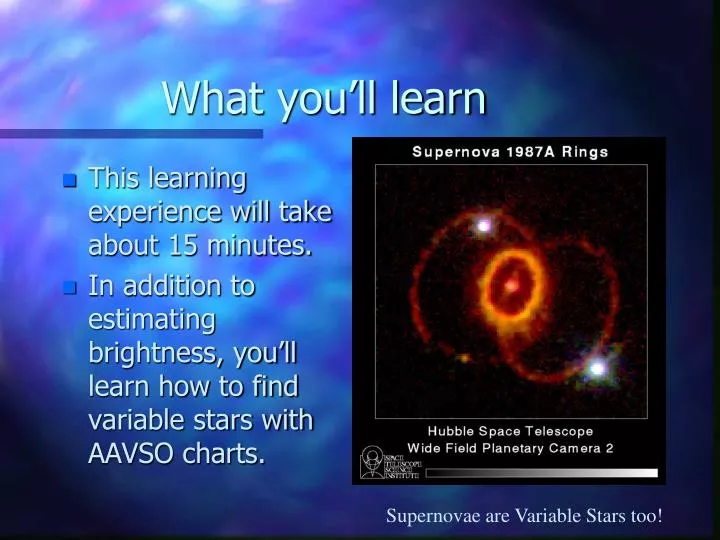
What you’ll learn. This learning experience will take about 15 minutes. In addition to estimating brightness, you’ll learn how to find variable stars with AAVSO charts. Supernovae are Variable Stars too!. What you’ll learn.

E N D
What you’ll learn • This learning experience will take about 15 minutes. • In addition to estimating brightness, you’ll learn how to find variable stars with AAVSO charts. Supernovae are Variable Stars too!
What you’ll learn • We’ll also cover how scientific data can be useful even when it contains “noise”. • You’ll learn that your observations can be very valuable, even while you’re learning to make better and better estimates. Constant (comparison) star Variable star CCD brightness data from long time AAVSO Member Lew Cook
Astronomy needs data! • The sky is full of wonderful things to see. • But, just looking at its beauty often doesn’t provide answers to the riddles of the universe. Hubble Space Telescope
Astronomy theories need data! • Most of the discoveries astronomers have made about the universe needed light measurements to confirm or suggest theories. (Time)
Data is information from instruments • There are all kinds of instruments astronomers use to make measurements of star brightness. • We call these measurements photometric data. • Photometric means light-measuring.
Your eyes are your instruments • You are going to use your own eyes and a special technique for making photometric measurements. • The technique is called: Interpolation of Magnitude.
What is interpolation? • Interpolation is a word scientists use when a measurement is estimated between two known values. • People interpolate all the time!
Interpolation • Your car’s gas gauge needle is half way between empty and 1/4 tank. • You interpolate you have 1/8 of a tank left--time to get gas! 1/2 1/4 3/4 E F
Interpolating star magnitude • Making a brightness estimate is easy in theory but requires some practice. • We call the measurement of brightness the star’s magnitude.
Interpolation of magnitude • We estimate the brightness of the variable star by using at least two stars of known brightness; one brighter than the variable, one fainter. Andromeda Galaxy (C. Pullen)
Interpolation of magnitude • Just like the gas tank example, if a star’s brightness seemed about half way between two stars that were known to be magnitudes 5.0 and 6.0, what is the magnitude of the variable star? Crab Nebula (C. Pullen)
Interpolation of magnitude • That’s right -- half way between 6.0 and 5.0 is 5.5!
How to find a variable star • The AAVSO makes thousands of star charts (sky maps, like road maps) used to find and estimate the magnitude of variable stars. • Because all AAVSO observers use the same charts, our results can very good, and can be compared with each other’s.
How to find a variable star • You have a copy of this AAVSO chart. It is for W Cygni, a star you can find with binoculars from you own yard. • But, first let’s try a simple lesson in interpolation and using star charts.
Variable and comparison stars Look at the example below. The variable is shown between the four focus lines. The magnitudes of the comparison (“comp”) stars are shown on the chart next to the stars (64,51,91, etc.). Variable
Decimal points can be confusing Note that the star magnitudes are actually decimals but we don’t show the decimal point because it could be confused as a star. So, the magnitudes below are really 6.4, 5.1, 9.1, etc. Variable
A big magnitude number is faint, a big dot is bright! The brighter the star is, the smaller its magnitude number. 5.1 is brighter than 6.4. On the chart, notice that the dot is bigger (brighter) for the 5.1 star than the 6.4 star to its left. Variable
Making your first estimate Is the variable brighter or fainter than the brightest (5.1) star?
Making your first estimate Is the variable brighter or fainter than the brightest (5.1) star? Fainter!
Making your first estimate Is the variable brighter or fainter than the next brightest star (6.1)? Variable
Making your first estimate Is the variable brighter or fainter than the next brightest star (6.1)? Fainter! Variable
Making your first estimate Is the variable brighter or fainter than the next brightest star (6.4)? Variable
Making your first estimate Is the variable brighter or fainter than the next brightest star (6.4)? Brighter! Variable
Here comes the gas gauge! So, the variable is brighter than 6.4 but not as bright as 6.1. What are you going to do with those numbers? Interpolate! Variable
Interpolation is an educated guess Is it about half way between 6.4 and 6.1? Then, your estimate would be 6.2 or 6.3. But, which one? Variable
Use your feelings Maybe you think it is just a little brighter than midway. Your estimate would be 6.2! A little fainter, your estimate would be 6.3. Don’t try to think what it should be, just go with the flow. Your ability to feel the best answer will get better with practice.
Making your first estimate • But, whatever your estimate, congratulations on your first variable star observation! • Write your result on the back of the star chart you were given.
Why do we call it an Estimate? • Different people will make different estimates of brightness using this method. We all see the world differently. • Yet, all the estimates are “right”! There is no one correct answer. • All scientific measurements have variation. We call it error or noise.
I thought scientists only used exact numbers! • Well, a number can never be too exact in science, especially astronomy. But, all measurements are really estimates to a certain precision. The trick is understanding what that precision is.
Precision in data The graph on the right is a portion of the AAVSO data that show the change in brightness over time of a star called SS Cygni. We call this a lightcurve. SS Cygni is located in the constellation of Cygnus the Swan. Brightness Time
Precision in data SS Cygni brightens dramatically every few months. Each dot represents a measurement made by an AAVSO observer somewhere in the world. We have records on some stars back to 1911! You can make measurements like these too! Brightness Time
Precision in data The magnitude is plotted on the Y axis (up and down) The day and time of the observation is plotted on the X axis (left and right) Brightness Time
Precision in data You can see the noise in the data. Note that the curve is not a nice straight line. Rather, it is a wide band of individual observations. Brightness Time
Every estimate is needed • Astronomers and physicists can use even noisy data to learn many things about how stars work. • With practice, AAVSO visual observers can estimate brightness to a precision near 0.1 magnitude. Artist’s Conception - SS Cygni (AAVSO)
There is no perfect estimate • Your observations are estimates because everyone gets a little different result. • You don’t have to be perfect--just do the best job you can. • Practice will help a lot!
Want to try again? Let’s Do It! Cat’s Eye Nebula (Hubble Space Telescope)
More practice This time, estimate the same variable but in frames B and C. These frames could be the variable star at different times in its light curve. Write your answers on the form.
How did it go? Was it easier the second and third time? I bet you are ready for a real star. Let’s try one!
W Cygni • We are now going to make two estimates of a semi- regular star called W Cygni (W Cyg). You should have its chart in front of you. • Click and it will be the next picture.
Are you able to find it? (Click for a little help!)
You’re kidding! • OK, there are lots of stars in the picture... • You will need to learn to “star hop” to the star you want. But it’s easy. • Here’s how!
W Cyg first estimation • Take a look at the AAVSO W Cyg (size aa) chart. • Hold it so that it is tilted about 45 degrees clockwise (to the right). It will better match the picture if tilted a little.
Why tilt the chart? • The way a group of stars looks in a telescope can vary because of the type of telescope, how you look into it, and the season or time of night. ?
Why tilt the chart? • Learning how to match the telescope view to the chart is something you’ll learn when actually observing. • But, back to our estimate!
Finding landmarks • Find the following things on your chart in this order: 1) M39 (star cluster) 2) Comp star 53 and a line of stars pointing from it to the south 3) Rho (pronounced “row”) Cyg, a Greek letter that looks like a “p” 4) W Cyg
I’ll give you some help. M39 5.3 Comp star with line to the south Rho Cyg W Cyg
Finding landmarks • This is how you star hop--from the easiest thing to see to the variable star. • Now, let’s try it on the photo! • We’ll go full screen and I’ll show you the landmarks we just found on our chart.
M39 W Cyg 53 comp with line of stars Rho Cyg
Can you find the landmarks on your own? See if you can find the comp stars as well. Did you find them?
Here are some of the comp stars. 74 55 59 67 Can you find any more?