Download
1 / 20
200 likes | 343 Views
Graph, Search Algorithms. Ka-Lok Ng Department of Bioinformatics Asia University. Content. How to characterize a biology network ? – Graph theory, topological parameters (node degrees, average path length, clustering coefficient, and node degree correlation.)

E N D
Graph, Search Algorithms Ka-Lok Ng Department of Bioinformatics Asia University
Content How to characterize a biology network ? – Graph theory, topological parameters (node degrees, average path length, clustering coefficient, and node degree correlation.) – Random graph, Scale-free network, Hierarchical network Search algorithm – Breadth-first Search, Depth-first Search
Biological Networks - metabolic networks Metabolism is the most basic network of biochemical reactions, which generate energy for driving various cell processes, and degrade and synthesize many different bio-molecules.
Biological Networks - Protein-protein interaction network (PIN) Proteins perform distinct and well-defined functions, but little is known about how interactions among them are structured at the cellular level. Protein-protein interaction account for binding interactions and formation of protein complex. - Experiment – Yeast two-hybrid method, or co-immunoprecipitation Limitation: No subcellular location, and temporal information. Cliques – protein complexes ? www.utoronto.ca/boonelab/proteomics.htm
Biological Networks - PIN Yeast Protein-protein interaction network - protein-protein interactions are not random - highly connected proteins are unlikely to interact with each other. Not a random network • Data from the high- • throughput two-hybrid • experiment (T. Ito, et al. • PNAS (2001) ) • The full set containing • 4549 interactions among • 3278 yeast proteins • 87% nodes in the largest • component • kmax ~285 ! • Figure shows nuclear • proteins only
Biological Networks – Gene regulation networks In a gene regulatory network, the protein encoded by a gene can regulate the expression of other genes, for instance, by activating or inhibiting DNA transcription. These genes in turn produce new regulatory proteins that control other genes. Example of a genetic regulatory network of two genes (a and b), each coding for a regulatory protein (A and B).
Biological Networks – Gene regulation networks Transcription regulatory network in H. sapiens Data courtesy of Ariadne Genomics obtained from the literature search: 1449 regulations among 689 proteins Transcription regulatory network in E. coli Data (courtesy of Uri Alon) was curated from the Regulon database: 606 interactions between 424 operons (by 116 TFs) Transcription regulatory network in Yeast - From the YPD database: 1276 regulations among 682 proteins by 125 transcription factors (~10 regulated genes per TF) - Part of a bigger genetic regulatory network of 1772 regulations among 908 proteins
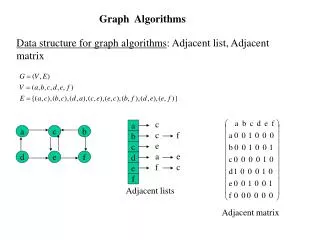
Graph Theory – Basic concepts Graphs G=(N,E) N={n1 n2,... nN} E={e1 e2,... eM} ek={ni nj} Nodes: proteins Edges: protein interactions Mutligraph ek={ni nj}+ duplicate edges i.e. em={ni nj} Nodes: proteins Edges: interactions of different sort: binding and similarity Hypergraphs Hyperedge: ex={ni, nj, nk ...} Nodes: proteins Edges: protein complexes Directed hypergraph Hyperedge: ex={ni, nj .. | nk nl ...} Nodes: substances Edges: chemical reactions A + B C +D eX={A, B .. | C, D ...} Directed graph ek={ni nj} Nodes: genes and their products Edges from A to B: gene regulation gene A regulates expression of gene B Different systems Different graphs
Graph Theory – Basic concepts Clustering coefficient Ci if A-B, B-C, then it is highly probable that A-C Node degree Components Complete graph (Clique) Shortest path length Two ways to compute Ci -Ei actual connections out of Ck2 possible connections -number of triangles that included i/ki(ki-1) Average clustering coefficient
1 3 2 4 Graph Theory – Vertex adjacency matrix Undirected graph ki 1 3 1 1 symmetric - ∞ means not directly connected - node i connectivity, ki= countj(mij = 1) Bipartite graph
G 1 a symmetric b 3 2 d 4 a b L(G) A(L(G)) = E(G) c d Graph Theory – Edge adjacency matrix a b c d a b c d c The edge adjacency matrix (E) of a graph G is identical to vertex adjacency matrix (A) of the line graph of G, L(G). That is the edge in G are replaced by vertices in L(G). Two vertices in L(G) are connected whenever the corresponding edges in G are adjacent. The labeling of the same graph G are related by a similarity transformation, P-1A(G1)P=A(G2).
Graph Theory – average network distance Interaction path length or average network distance, d • the average of the distances between all pairs of nodes • frequency of the shortest interaction path length, f(L) • determined by using the Floyd’s algorithm The average network diameter d is given by where L is the shortest path length between two nodes. Network diameter (global) Average network distance (local)
1 3 2 4 i j k Graph Theory – the shortest path The shortest path • Floyd algorithm, an O(N3) algorithm. For iteration n, • given three nodes i, j and k, it is shorter to reach j from i by passing through k Mnij=min{Mn-1ij, Mn-1ik+Mn-1kj} - search for all possible paths, e.g. 1-2, 1-2-3, 1-2-4, 2-3, 2-4
Random Graph Theory = Graph Theory +Probability
Random Graph Theory = Graph Theory +Probability
Random Graph Theory= Graph Theory + Probability Random graph (Erdos and Renyi, 1960) N nodes labeled and connected by n edges • CN2 = N(N-1)/2 possible edges • possible graphs with N nodes and n edges N = 4 C6n N = 4 n 3 3 4 4 5 6
Search Algorithms • Find the shortest route, in terms of distance between nodes S and G. • A matrix representation of the graph in Figure 3.1
Search Algorithms – Breadth-first search (BFS) • Nodes are expanded in the order in which they are generated. S is expanded into A, B, and C, which are generated in the order 1,2,and 3. • A is expanded first to B, C and D, which has generation order 4, 5 and 6 • BFS goes back to node B and expands that next to A, C and E (generation order 7, 8 and 9) and then goes back to node 3 (C) and expands that to A, B, D, E and F (generation order 10, 11, 12, 13 and 14).
Search Algorithms – Depth-first search (DFS) • Begin from the root node of the tree • Visited the first unvisit node, then marked this node • Then find the next unvisit node, then marked this node • When proceed, all the nodes are already visited, go back to the parent node