Download
1 / 26
260 likes | 278 Views
Explore logistic and linear regression using SAS macros with a binary factor model and continuous factor model examples. Analyze Maximum Likelihood Estimates, Odds Ratios, and Multivariate vs. Univariate results. Understand the impact of independent variables on outcomes.

E N D
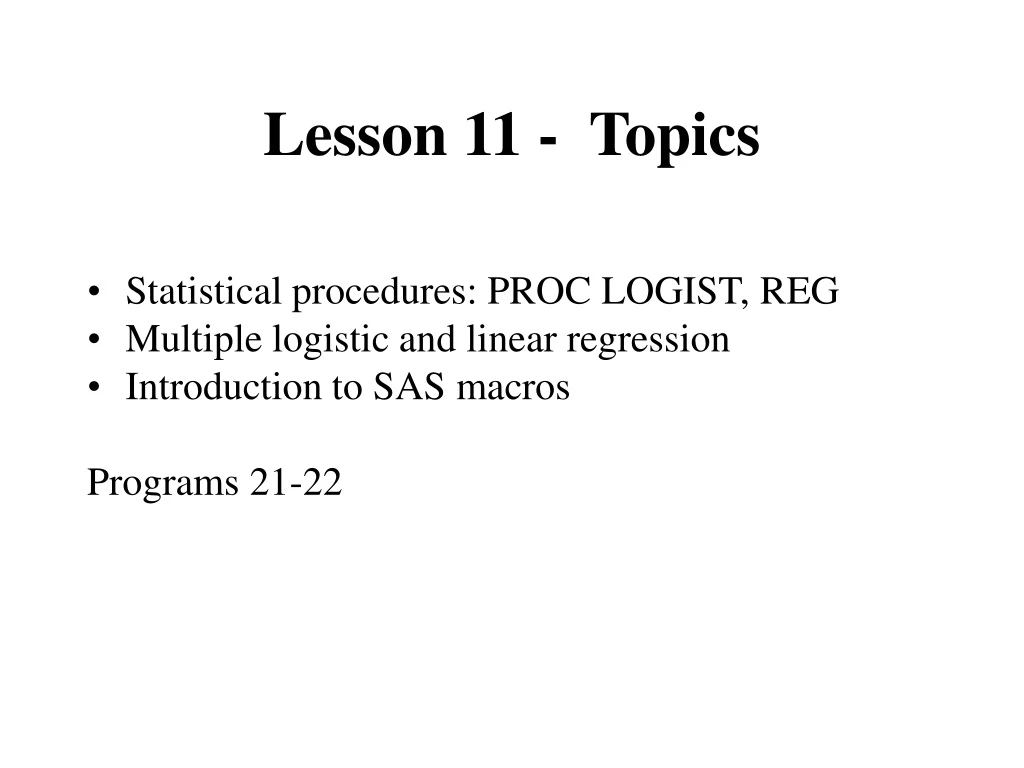
Lesson 11 - Topics • Statistical procedures: PROC LOGIST, REG • Multiple logistic and linear regression • Introduction to SAS macros Programs 21-22
Logistic Regression Model a binary factor (yes/no) as a function of one or more independent variables. TOMHS Example: Smoking as a function of age, gender, race, and education Log(p/1-p) = b0 +b1x1 + b2x2 + bkxk
DATA stat ; INFILE '~/SAS_Files/tomhsfull.data' ; INPUT @1 ptid $10. @27 age 2. @30 sex 1. @32 race 1. @49 educ 1. @51 eversmk 1. @53 nowsmk 1. @180 energy 5. ; if race = 2 then aa = 1; else aa = 0; if sex = 2 then women = 1; else women = 0; if educ in(1,2,3,4,5,6) then collgrad = 0; else if educ in(7,8,9) then collgrad = 1; if eversmk = 2 then currsmk = 2; else currsmk = nowsmk;
if eversmk = 2 then currsmk = 2; else currsmk = nowsmk; Did you ever smoke cigarettes? 1 = yes, 2= no Do you now smoke cigarettes? 1 = yes, 2= no Var: eversmk Var: nowsmk Note: Second question only answered if first question is answered yes.
PROC MEANS; VAR age women collgrad aa ; CLASS currsmk; RUN; N currsmk Obs Variable N Mean ------------------------------------------------------ 1 98 age 98 52.31 women 98 0.44 collgrad 98 0.23 aa 98 0.45 2 801 age 801 55.08 women 801 0.38 collgrad 799 0.38 aa 801 0.17 ------------------------------------------------------
ODS SELECT ParameterEstimates OddsRatios PROC LOGIST; MODELcurrsmk = age women collgrad aa ; RUN; Analysis of Maximum Likelihood Estimates Standard Wald Parameter DF Estimate Error Chi-Square Pr > ChiSq Intercept 1 1.7422 1.0235 2.8976 0.0887 age 1 -0.0732 0.0189 15.0704 0.0001 women 1 -0.2367 0.2407 0.9672 0.3254 collgrad 1 -0.6866 0.2618 6.8805 0.0087 aa 1 1.3394 0.2416 30.7354 <.0001 Odds Ratio Estimates Point 95% Wald Effect Estimate Confidence Limits age 0.929 0.896 0.964 women 0.789 0.492 1.265 collgrad 0.503 0.301 0.841 aa 3.817 2.377 6.128 OR = exp(estimate) OR (age) = exp(-0.07) = 0.93
Comparison of univariate versus multivariate results Multivariate Standard Wald Parameter DF Estimate Error Chi-Square Pr > ChiSq Intercept 1 1.7422 1.0235 2.8976 0.0887 age 1 -0.0732 0.0189 15.0704 0.0001 women 1 -0.2367 0.2407 0.9672 0.3254 collgrad 1 -0.6866 0.2618 6.8805 0.0087 aa 1 1.3394 0.2416 30.7354 <.0001 Univariate (Separate regression runs) Standard Wald Parameter DF Estimate Error Chi-Square Pr > ChiSq Intercept 1 1.7422 1.0235 2.8976 0.0887 age 1 -0.0736 0.0185 15.8221 <.0001 women 1 0.2561 0.2162 1.4026 0.2363 collgrad 1 -0.6945 0.2492 7.7635 0.0053 aa 1 1.4091 0.2242 39.5071 <.0001 Note: Women more likely to be AA then men in TOMHS and AA more likely to be smokers.
Linear Regression Model a continuous factor as a function of one or more independent variables. TOMHS Example: Energy (calories) intake as a function of age, gender, race, and education
ODS SELECT ParameterEstimates ; PROC REG; MODELenergy = age women collgrad aa ; RUN; The REG Procedure Model: MODEL1 Dependent Variable: energy Parameter Estimates Parameter Standard Variable DF Estimate Error t Value Pr > |t| Intercept 1 3574.78842 184.91689 19.33 <.0001 age 1 -20.67969 3.25993 -6.34 <.0001 women 1 -570.45804 44.34733 -12.86 <.0001 collgrad 1 -109.19062 44.01230 -2.48 0.0133 aa 1 -253.62159 54.07279 -4.69 <.0001 Energy = 3575 -21*age – 570*women – 109*collgrad – 253*aa
Multivariate Analysis Parameter Standard Variable DF Estimate Error t Value Pr > |t| age 1 -20.67969 3.25993 -6.34 <.0001 women 1 -570.45804 44.34733 -12.86 <.0001 collgrad 1 -109.19062 44.01230 -2.48 0.0133 aa 1 -253.62159 54.07279 -4.69 <.0001 Univariate Analysis (Separate regression runs) Parameter Standard Variable DF Estimate Error t Value Pr > |t| age 1 -17.1154 3.60184 -4.75 <.0001 women 1 -595.40078 43.74189 -13.61 <.0001 collgrad 1 41.21749 48.61549 0.85 0.3968 aa 1 -388.19448 57.32940 -6.77 <.0001 Women less likely to be college graduates and also to have lower coloric intake.
PROC MEANS; VARenergy; CLASS women aa collgrad; RUN; Analysis Variable : energy N women aa collgrad Obs N Mean -------------------------------------------------------------------------- 0 0 0 277 276 2445.043 1 213 213 2338.319 1 0 42 42 2141.714 1 23 23 1992.261 1 0 0 162 162 1795.938 1 71 71 1853.366 1 0 92 92 1694.196 1 20 20 1532.300 --------------------------------------------------------------------------
Macro Variables and Use LIBNAME t ‘C:\SAS_Files'; %let nut = kcalbl dcholbl calcbl sodbl; %let cat = clinic; DATA temp; SET t.tomhs (KEEP=ptid &nut &cat); RUN; PROCMEANSDATA=temp ; VAR &nut ; CLASS &cat; TITLE"PROC Means results for variables &nut by &cat"; RUN; * Makes it easy to modify code;
Macro Variables • Defined using %LET statement • Referenced by using ¯ovarname • SAS substitutes the value of macrovarname when it encounters ¯ovarname • Useful for making a program easy to modify • Usually put near top of program %let macrovarname = characters ;
Simple Macro to Shorten Code Suppose I want to compute the change in 4 variables at 3 time points. Can use macro to help you. Variables: Dbp12,24,36 and dbpbl Sbp12,24,36 and sbpbl Chol12,24,36 and cholbl Gluc12,24,36 and glucbl %macro change(v); dbpdif&v = dbp&v - dbpbl; sbpdif&v = sbp&v - sbpbl; choldif&v = chol&v - cholbl; glucdif&v = gluc&v - glucbl; %mend change; option mprint; * Shows code generated in the log; data temp; set temp; %change(12); %change(24); %change(36); run;
Simple Macro to Shorten Code %macro change(v); 36 %change(12); MPRINT(CHANGE): dbpdif12 = dbp12 - dbpbl; MPRINT(CHANGE): sbpdif12 = sbp12 - sbpbl; MPRINT(CHANGE): choldif12 = chol12 - cholbl; MPRINT(CHANGE): glucdif12 = gluc12 - glucbl; 36 %change(24); MPRINT(CHANGE): dbpdif24 = dbp24 - dbpbl; MPRINT(CHANGE): sbpdif24 = sbp24 - sbpbl; MPRINT(CHANGE): choldif24 = chol24 - cholbl; MPRINT(CHANGE): glucdif24 = gluc24 - glucbl; 37 %change(36); MPRINT(CHANGE): dbpdif36 = dbp36 - dbpbl; MPRINT(CHANGE): sbpdif36 = sbp36 - sbpbl; MPRINT(CHANGE): choldif36 = chol36 - cholbl; MPRINT(CHANGE): glucdif36 = gluc36 - glucbl; 38 run; SAS substitutes the value of v everywhere there is an &v
Another Macro Example Goal of Macro named Summary: For a given dataset give summary statistics using PROC CONTENTS, MEANS and FREQ and (optionally) display the data using PROC PRINT. Instead of having to write the code each time, write a macro.
Name of macro %macro summary ( dataset=, mvar=_numeric_, fvar = _character_, print=N, pvar=_all_); Parameters to Macro = defaults dataset: Name of dataset used mvar: List of variables to run for PROC MEANS (default is all numeric var) fvar: List of variables to run for PROC FREQ (default is all character var) print: If set to Y then run PROC PRINT (default is N) pvar: List of variables to run for PROC PRINT Remember: SAS Macros generate SAS code when you call it
Parameters to Macro Name of macro %macro summary ( dataset=, mvar=_numeric_, fvar = _character_, print=N, pvar=_all_); proc contents data=&dataset varnum; run; proc means data=&dataset; var &mvar; run; proc freq data=&dataset; tables &fvar; run; %if &print = Y %then %do; proc print data=&dataset; var &pvar; run; %end; %mend summary; This will generate the proc print code only if the macro variable print equals Y.
* This is the macro; proc contents data=&dataset varnum; run; proc means data=&dataset; var &mvar; run; proc freq data=&dataset; tables &fvar; run; %if &print = Y %then %do; proc print data=&dataset; var &pvar; run; %end; CALL TO MACRO: libname t ‘C:/PH6420/data/'; data tomhs; set t.tomhs; run; option mprint; * Call with only dataset given; %summary (dataset=tomhs); Code Generated: MPRINT(SUMMARY): proc contents data=tomhs varnum; MPRINT(SUMMARY): run; MPRINT(SUMMARY): proc means data=tomhs; MPRINT(SUMMARY): var _numeric_; MPRINT(SUMMARY): run; MPRINT(SUMMARY): proc freq data=tomhs; MPRINT(SUMMARY): tables _character_; MPRINT(SUMMARY): run;
* This is the macro; proc contents data=&dataset varnum; run; proc means data=&dataset; var &mvar; run; proc freq data=&dataset; tables &fvar; run; %if &print = Y %then %do; proc print data=&dataset; var &pvar; run; %end; CALL TO MACRO: libname t ‘C:/PH6420/data/'; data tomhs; set t.tomhs; run; option mprint; %summary (dataset=tomhs, print=Y); Code Generated: MPRINT(SUMMARY): proc contents data=state varnum; MPRINT(SUMMARY): run; MPRINT(SUMMARY): proc means data=state; MPRINT(SUMMARY): var _numeric_; MPRINT(SUMMARY): run; MPRINT(SUMMARY): proc freq data=state; MPRINT(SUMMARY): tables _character_; MPRINT(SUMMARY): run; MPRINT(SUMMARY): proc print data=state; MPRINT(SUMMARY): var _all_; MPRINT(SUMMARY): run;
* This is the macro; proc contents data=&dataset varnum; run; proc means data=&dataset; var &mvar; run; proc freq data=&dataset; tables &fvar; run; %if &print = Y %then %do; proc print data=&dataset; var &pvar; %end; CALL TO MACRO: libname t ‘C:/PH6420/data/'; data tomhs; set t.tomhs; run; option mprint; %summary (dataset=tomhs, fvar=clinic sex); Code Generated: MPRINT(SUMMARY): proc contents data=tomhs varnum; MPRINT(SUMMARY): run; MPRINT(SUMMARY): proc means data=tomhs; MPRINT(SUMMARY): var _numeric_; MPRINT(SUMMARY): run; MPRINT(SUMMARY): proc freq data=tomhs; MPRINT(SUMMARY): tables clinic sex; MPRINT(SUMMARY): run;
-------------------------------------------------------------------------------------------------------------------------------------------- | | Diastolic BP at 12-Months | | |---------------------------------------| | | N | Mean | Std | Min | Max | |----------------------------+-------+-------+-------+-------+-------| |Study Group (1-6) | | | | | | |1 | 15| 77.8| 9.3| 68.0| 94.0| |2 | 17| 81.7| 7.1| 72.0| 100.0| |3 | 14| 78.1| 7.6| 67.0| 90.0| |4 | 14| 77.7| 6.0| 66.0| 89.0| |5 | 13| 79.6| 8.5| 66.0| 99.0| |6 | 19| 79.6| 7.3| 64.0| 95.0| |All | 92| 79.2| 7.6| 64.0| 100.0| ---------------------------------------------------------------------- proc tabulate data=_last_ noseps; class group; var sbp12; table (group all), (sbp12)*(n*f=7.0 mean*f=7.1 std*f=7.1 min*f=7.1 max*f=7.1)/rts=30; run;
MACRO BRKSPSS: Creates tabulate table for each var in dlist by group %macro brkspss (grp,dlist,data=_last_,dec=3,all=all); %do I = 1 %to 100; %let depvar = %scan(&dlist,&i); %let %length(&depvar) = 0 %then %goto done; proc tabulate data=&data noseps; class &grp; var &depvar; table (&grp &all), (&depvar)*(n*f=7.0 mean*f=7.&dec std*f=7.&dec min*f=7.&dec max*f=7.&dec)/rts=30; run; %end; %done: %mend brkspss; %brkspss(group,dbp12 sbp12 chol12);
MACRO BRKSPSS: Creates tabulate table for each var by group LIBNAME t '~/PH6420/2017/Data/'; DATA stat; set t.tomhs; RUN; * Example calls; %brkspss(group,dbp12 sbp12 chol12); %brkspss(group,dbp12 sbp12 chol12, dec=1); * Just 1-decimal; %brkspss(group,dbp12 sbp12 chol12, all=); * No totals;
Output from last call: First 2 variables. ---------------------------------------------------------------------- | | Diastolic BP at 12-Months | | |---------------------------------------| | | N | Mean | Std | Min | Max | |----------------------------+-------+-------+-------+-------+-------| |Study Group (1-6) | | | | | | |1 | 15| 77.800| 9.314| 68.000| 94.000| |2 | 17| 81.706| 7.078| 72.000|100.000| |3 | 14| 78.071| 7.580| 67.000| 90.000| |4 | 14| 77.714| 5.954| 66.000| 89.000| |5 | 13| 79.615| 8.540| 66.000| 99.000| |6 | 19| 79.579| 7.313| 64.000| 95.000| ---------------------------------------------------------------------- ---------------------------------------------------------------------- | | Systolic BP at 12-Months | | |---------------------------------------| | | N | Mean | Std | Min | Max | |----------------------------+-------+-------+-------+-------+-------| |Study Group (1-6) | | | | | | |1 | 15|120.200| 12.537| 93.000|141.000| |2 | 17|124.118| 11.280|108.000|142.000| |3 | 14|117.429| 9.436|104.000|135.000| |4 | 14|127.571| 11.876|112.000|149.000| |5 | 13|123.154| 18.348| 94.000|158.000| |6 | 19|129.895| 12.987|105.000|154.000| ----------------------------------------------------------------------
Where to put macro? • At beginning of program before you call it %macro brkspss(parameters); … macro code %mend brkspss; %brkspss (group, dbp12 sbp12, data=tomhs); • Save as separate sas file and %include file on top of program. %include ‘/folderpath/brkspss.sas’; %brkspss(group, dbp12 sbp12, data=tomhs);