Download
1 / 47
470 likes | 491 Views
Explore the impacts of climate change on extreme weather events such as heatwaves, wildfires, and blizzards. Learn about record-breaking temperatures, devastating wildfires, and paralyzing blizzards, and understand how global warming influences the frequency and intensity of these events.

E N D
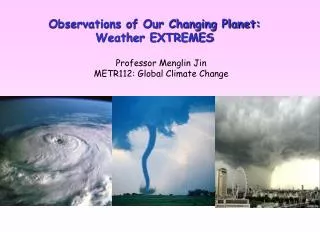
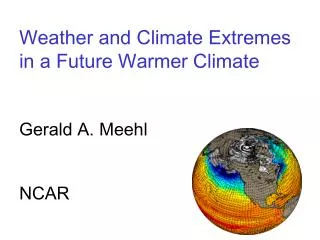
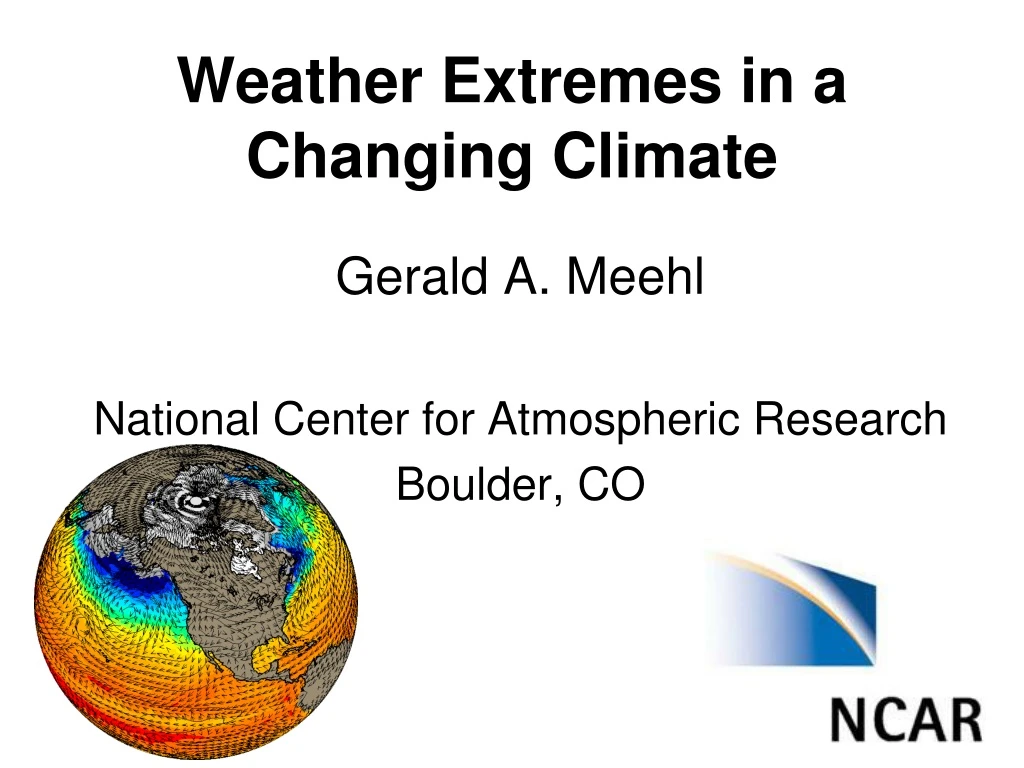
Weather Extremes in a Changing Climate Gerald A. Meehl National Center for Atmospheric Research Boulder, CO
June 26, 2012, 3:10PM “Flagstaff Fire” behind NCAR burning for about 2 hours, NCAR evacuated The two days prior to the Boulder Flagstaff fire, Boulder set record highs for those days of 101°(driest March-June on record)
June 26, 2012, 5:40PM “Flagstaff Fire” burning for about 4.5 hours, reverse 911 call to the Meehl house in south Boulder with “pre-evacuation” notice (lifted 2 days later; 90% containment of the 300 acre fire by July 1)
Record heat and record wildfires Three days earlier, the day the Waldo Canyon fire broke out in Colorado Springs (above, June 23, 2012), that city set it’s all-time record high of 101° the most destructive fire in Colorado history destroyed 346 homes, 2 dead
Record Texas wildfires 2011 Hottest and driest summer in Texas history
Record 2010 Russian heat wave and wildfires More than 20 daily temperature records were broken including the absolute maximum temperature in Moscow (101F) Over 2,000 houses destroyed by fires and about 4,000 people left homeless, wildfires burned in 17 Russian regions, and a state of emergency was declared. A heavy smog from the wildfires blanketed Moscow, concentration of toxic particles reached dangerous levels. Estimates put the death toll at about 55,000
Record heat and record Australian bushfires February 7, 2009 largest natural disaster in Australia’s history 173 dead, over 400 injured, ~1800 houses destroyed, ~200 businesses and other buildings destroyed,
The day of the fires, Melbourne set an all-time record high temperature of 115.5° Record-setting heat wave the week before, three days in a row above 109° Preceded by 8 years of severe drought in southern Australia
Fire rages; 10,000 homes evacuated (July 26, 2016, Los Angeles Times) Los Angeles—Wind-whipped flames raged overnight in the steep, rugged mountains of the Santa Clarita Valley, charring more than 33,000 acres and threatening thousands of homes. The Sand Fire continued to burn Monday in the hills toward Acton. Decades without a major fire and years of drought left the valley primed for a fast-moving fire that was fueled by excessive heat, low humidity and extreme dry fuels.
Heat Waves Impacts on human health and mortality, economic impacts, ecosystem and wildlife impacts
The 2003 European heat wave led to the hottest summer on record in Europe since at least 1540. France was hit especially hard. The heat wave led to health crises in several countries and combined with drought to create a crop shortfall in parts of Southern Europe. Peer-reviewed analysis places the European death toll at more than 70,000.
Dangerous heat wave to persist in northeastern US much of this week By Andy Mussoline, AccuWeather.com Senior Meteorologist July 26, 2016; 3:54 PM ET A stifling heat wave will remain entrenched across the mid-Atlantic and Northeast much of this week. In wake of a stormy Monday across the Northeast, the heat will not budge in areas from Washington, D.C., to New York City and Boston as AccuWeather heat index temperatures soar into the upper 90s and lower 100s F through this week. "The heat wave will continue unabated this week," AccuWeather Senior Meteorologist Dave Dombek said.
But heat waves occur every summer. Are they really getting worse?
Heat wave intensity has been increasing over the U.S. (trend from 1961-1990 in the Karl-Knight heatwave index, which tracks the warmest average minimum temperature over three consecutive nights in a year)
But sometimes it gets really cold! Blizzard Paralyzes New York City, Boston (Dec 27, 2010) A powerful winter storm slammed the I-95 corridor from Philadelphia to Boston on Sunday. Through today, the blizzard will bring travel to a standstill along the coastline of northern New England as well. The storm unleashed around a foot of snow and howling winds in cities and towns from Philadelphia through New York City to Boston as it advanced northward offshore Sunday and Sunday night. Nearly a foot of snow piled up in the Boston area on Sunday, December 26, 2010. London Comes to a Standstill During the Holiday Season Because of Snow and Ice LONDON, UNITED KINGDOM--(Dec. 29, 2010) - December is expected to go down as the coldest on record. With reports of 5 inches of snow in London, Gatwick Airport cancelled all flights and Heathrow cancelled all incoming flights on the weekend but had a few selected flights depart from the airport instead. This left many passengers planning on spending the Holidays overseas to find other plans until the snow is completely cleared.
How global warming affects heat extremes: on any given day, there is a greater probability of a temperature near average, and a lower probability of extreme cold or extreme heat
How global warming affects heat extremes: a relatively small increase in the average temperature produces an increased chance of extreme high temperatures and record high temperatures, and a decreased chance of extreme low temperatures and record low temperatures There can still be extreme cold days and record cold temperatures in a climate that is warmer on average, but there is a greater chance for extreme heat and record high temperatures
With global warming, there is a shift to warmer temperatures, thus increasing the risk of record-setting extreme heat (and record wildfires in areas already at risk for wildfires) Global warming by itself doesn’t cause extreme conditions, but it makes naturally occurring events more extreme So we should be seeing an increase in heat extremes
Global warming shifts the odds towards a better chance for more daily record high temperatures compared to record lows we’ve been observing an increase in record highs compared to record lows
National Climatic Data Center web site archives observed annual daily record high maximum and record low minimum temperatures from weather stations across the U.S. http://www.ncdc.noaa.gov/oa/climate/research/records/ As of July 26, 2016: January 1, 2000 to January 1, 2010: 313,799 record daily high maximum temperatures set, and 154,388 record daily low minimum temperatures, a ratio of roughly two to one (2.04 : 1). January 1, 2010 to January 1, 2011: 19,213 record highs and 8,374 record lows, a ratio of a bit more than two to one (2.3 : 1). Since January 1, 2016: 13,671 record highs, 2,347 record lows A ratio of nearly seven to one The increasing ratio of record highs to record lows is the signature of global warming
Summer 2010 Pakistan floods More than 15 million across Pakistan were affected by the floods, which submerged one-fifth of the country and laid waste to infrastructure and crop land; The monsoon-triggered floods that began in late July spread from the north to the south of the country, swelling rivers and submerging hundreds of villages. Flooding near Multan in Punjab Province, Pakistan, August 15, 2010
January 2011, Australia: 20 towns cut off or flooded across an area larger than France and Germany A senior official described the flooding in Queensland, Australia, as a disaster of "biblical proportions". The floods, Queensland’s worst in 50 years, were triggered by Australia's wettest spring on record. At least six river systems across Queensland broke their banks. The floods affected about 200,000 people, and many were evacuated.
September 2013 Boulder flood In a five day period in September, 2013, usually one of the driest months of the year, Boulder received nearly 18” of rain, close to the annual total rainfall for Boulder Every road in every canyon west of Boulder from Denver to Ft. Collins washed out isolating thousands prompting the largest helicopter evacuation (more than 1200 people) since Hurricane Katrina in New Orleans It’s estimated that half the houses with basements in Boulder experienced water damage Mudslides near the mouth of Boulder Canyon destroyed structures
BRAN fiber exposed by Bear Creek flooding below NCAR Repairing the BRAN fiber and gas main Boulder Creek in downtown Boulder Small drainages coming off the Flatirons turned into raging torrents that rampaged down streets in neighborhoods far from Boulder Creek
The grounds around the Millennium flooded
But we’ve always had intense rain and floods. Is it getting worse? As the oceans warm from increasing human-produced greenhouse gases, evaporation increases Warmer air can hold more moisture That additional moisture in the air increases the moisture supply for storms Precipitation (rain and snow) becomes more intense (i.e. for a given storm event, more precipitation falls) because of this increased moisture supply So with the warming climate over the 20th and early 21st century, we should be seeing an increase in precipitation intensity
There has been an observed increase in precipitation intensity over the U.S. as the climate has warmed (1958-2012)
US National Climate Assessment, 2013: two-day precipitation total that is exceeded on average only once in a 5-year period, also known as the once-in-five-year event. Changes are compared to the period 1901-1960, and do not include Alaska or Hawai‘i
What will extremes do in the future? We study possible future changes in weather and climate extremes with climate models
To study weather and climate extremes, you need to be able to credibly simulate weather and climate in a numerical model simulate this: with this: Resolution of climate models is improving: 1995: about 500 km 2000: about 250 km 2005: about 150 km 2011: about 50 km 2016: about 25 km
¼ degree (grid points every 25 km) simulation representative of present-day climate (about 2 model years per day; about 300 Gb of data per model year)
Climate models can be used to provide information on future changes in extreme events such as heat waves Heat wave severity defined as the mean annual 3-day warmest nighttime minima event Model compares favorably with present-day heat wave severity In a future warmer climate, heat waves become more severe in southern and western North America, and in the western European and Mediterranean region (Meehl, G.A., and C. Tebaldi, 2004: More intense, more frequent and longer lasting heat waves in the 21st century. Science, 305, 994--997.) Observed Model Future
How can global warming produce both increasing hot/dry conditions and increased precipitation intensity? In a warming climate, precipitation in climate models is projected to become more intense almost everywhere In many of those same areas the climate model projections show an increase of “dry days” (number of days between precipitation events) (Tebaldi , C., J.M. Arblaster, K. Hayhoe, and G.A. Meehl, 2006: Going to the extremes: An intercomparison of model-simulated historical and future changes in extreme events. Clim. Change, 79, doi 10.1007/s10584-006-9051-4.)
What about future hurricanes? the indications so far: fewer total, but the ones that form will be more intense (Tropical cyclone tracks from a global 20 km resolution atmospheric model) (Oouchi et al., 2006)
“You can’t attribute any specific weather extreme to climate change”
2016 report from the National Academy of Sciences Now: “You can say something quantitative about how human climate change has increased the risk of certain extremes (e.g. heat waves, extreme precipitation)” e.g. World Weather Attribution (https://wwa.climatecentral.org/)
2 methods to assess human influence on 2015 European summer heat wave: 1. With observations: Compare this heat wave with heat waves that occurred in the early 20th century before human-caused climate change: human-induced climate change at least quadrupled the chances of seeing a heat wave like the one in 2015 2. With climate models: compare the likelihood of seeing days as hot as this heat wave in a present-day climate simulation, with those simulated without human-influenced climate change. Comparing those two “worlds,” this type of heat wave is now at least twice as likely due to human-caused climate change
What does the future hold? Possible futures: With aggressive mitigation, globally averaged surface temperatures stabilize about 2050 and then slowly decrease to meet the 2C target (and possibly the new 1.5C target from the recent Paris negotiation)
Future CO2 emissions required to achieve future CO2 concentrations (emissions have to drop for concentrations to stabilize due to long lifetime of CO2 in the atmosphere) Concentrations required to attain 2C target Emissions required to attain 2C target Negative emissions by about 2080
If someone asks you, “Did humans cause this [heat wave, flood, temperature record]?”
If someone asks you, “Did humans cause this [heat wave, flood, temperature record]?” You can answer, “Think about steroids, baseball, climate change, and extremes”
Summary Record heat = record wildfires A relatively small shift in the average produces a very large change in extremes—more extreme heat and less extreme cold, and more record high maximum temperatures and fewer record low minimum temperatures Global warming by itself doesn’t cause extreme conditions, but it makes naturally occurring events even more extreme In a future warmer climate: Increased heat wave intensity, duration and frequency Decreased cold spells (extreme cold weather will still occur, but less frequently) Increased precipitation intensity, but increases in dry days in some locations Increasing ratio or record highs to record lows projected to increase as the climate warms: e.g. about 20 to 1 by mid-century, 50 to 1 by late century A warmer climate produces fewer total hurricanes, but the ones that form are more intense
Steroids and ClimateSteroids analogy:http://www2.ucar.edu/atmosnews/attribution/steroids-baseball-climate-change
Global warming affected Superstorm Sandy in at least two ways: • Higher mean sea level = more extreme storm surge • more intense precipitation