Download
1 / 46
460 likes | 470 Views
Explore original data on time spent on mathematics instruction, course offerings, completion rates, and access to Advanced Placement Math courses in schools. Gain valuable insights into the implementation of mathematics programs and practices at different educational levels.

E N D
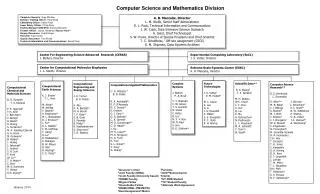
Chapter 4Science, Mathematics, and Computer Science Courses • Mathematics
Frequency with Which Self-Contained Elementary Classes Receive Mathematics Instruction
Average Number of Minutes Per Day Spent Teaching Each Subject in Self-Contained Classes
Middle Schools With Percentages of 8th Grade Students Completing Algebra 1 and Geometry Prior to 9thGrade
8th Grade Students Completing Algebra 1 and Geometry Prior to 9th Grade, by Percentage of Students in School Eligible for FRL
8th Grade Students Completing Algebra 1 and Geometry Prior to 9th Grade, by Community Type
Average Number of AP Mathematics Courses Offered at High Schools, by Percentage of Students Eligible for FRL
Average Number of AP Mathematics Courses Offered at High Schools
Average Number of AP Science Courses Offered at High Schools
Mathematics Programs and Practices Currently Being Implemented at High Schools
Mathematics Programs and Practices Currently Being Implemented at High Schools
Average Percentages of Female and Historically Underrepresented Students in Classes
Average Percentages of Female Students in High School Mathematics Courses
Average Percentage of Historically Underrepresented Students in High School Mathematics Courses
Prior Achievement Grouping in High School Mathematics Classes
Prior Achievement Grouping in High School Mathematics Classes
Prior Achievement Grouping in Elementary Mathematics Classes
Prior Achievement Grouping in Middle School Mathematics Classes
Prior Achievement Grouping in High School Mathematics Classes