Download
1 / 20
200 likes | 215 Views
Processing LED On the Map Data. Jeff Arp – Nonprofit Center of Milwaukee. On the Map Output. http://lehd.did.census.gov/led/onthemap/. LED Tables. OD = 4(ja, jp, pa, pp) x 2 (main, aux) = 8 RAC = 4(ja, jp, pa, pp) x 10(age1, age2, age3, earn1, earn2, earn3, ind1, ind2, ind3,total) = 40

E N D
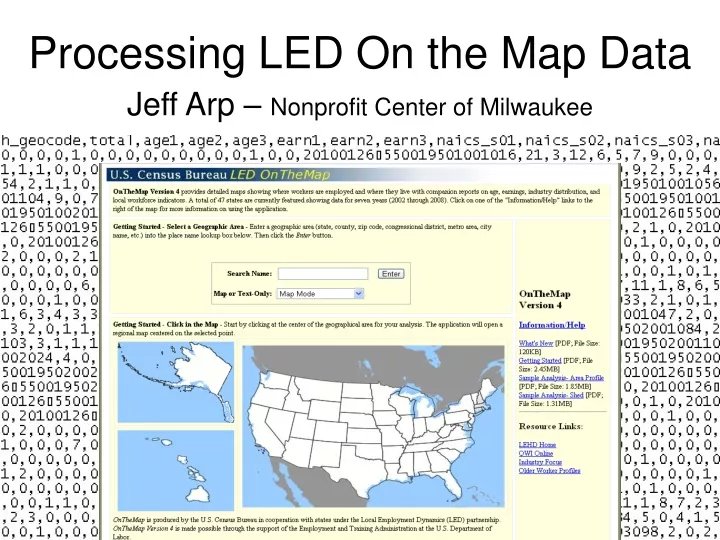
Processing LED On the Map Data Jeff Arp – Nonprofit Center of Milwaukee
LED Tables • OD = 4(ja, jp, pa, pp) x 2 (main, aux) = 8 • RAC = 4(ja, jp, pa, pp) x 10(age1, age2, age3, earn1, earn2, earn3, ind1, ind2, ind3,total) = 40 • WAC = 4(ja, jp, pa, pp) x 10(age1, age2, age3, earn1, earn2, earn3, ind1, ind2, ind3,total) = 40 • OD + RAC + WAC = 88 x 6yr = 528
LED Tables • OD = 4(ja, jp, pa, pp) x 2 (main, aux) = 8 • RAC = 4(ja, jp, pa, pp) x 10(age1, age2, age3, earn1, earn2, earn3, ind1, ind2, ind3,total) = 40 • WAC = 4(ja, jp, pa, pp) x 10(age1, age2, age3, earn1, earn2, earn3, ind1, ind2, ind3,total) = 40 • OD + RAC + WAC = 88 x 6yr = 528
LED Tables • OD = 4(ja, jp, pa, pp) x 2 (main, aux) = 8 • RAC = 4(ja, jp, pa, pp) x 10(age1, age2, age3, earn1, earn2, earn3, ind1, ind2, ind3,total) = 40 • WAC = 4(ja, jp, pa, pp) x 10(age1, age2, age3, earn1, earn2, earn3, ind1, ind2, ind3,total) = 40 • OD + RAC + WAC = 88 x 6yr = 528
DownThemAll OD processing • Extract to CSV Convert to DBF Combine WI 'Main' & Aux files Import WI Records from 'Aux' files of other states
Import WI Records from 'Aux' files of other states Add X and Y Coords of block centroid for O & D Calculate O-D Distance Use File for Stats Total on O for Mapping Residents Total on D for Mapping Workplaces
Workplaces Residents
Workplaces Residents
Extract to CSV DownThemAll (age1, age2, age3, earn1, earn2, earn3, ind1, ind2, ind3,total) RAC/ WAC processing Convert to DBF Collapse 10 tables into 1 Put all years into 1 tablefor stats (1 rec per census block per year) Use one year files for mapping
Age1 table All Cross table Age2 table Age3 table
Workplaces Residents
Things to consider • Processing time • HD Space • LED Data issues/anomalies