Download
1 / 19
190 likes | 200 Views
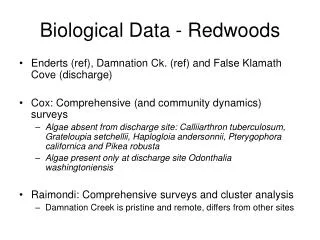
This course covers significance tests for continuous variables, including parametric and non-parametric tests for normally and not normally distributed data. Topics include t-tests, ANOVA, Wilcoxon test, and Kruskal-Wallis test. Practice exercises included.

E N D
Statistics for biological data Significance tests for continuous variables Aya Elwazir Teaching assistant of medical genetics, FOMSCU PHD student, University of Sheffield
Choice of test NOT normally distributed Normally distributed Median (IQR) Mean ± SD Descriptives Significance tests Parametric tests Non-Parametric tests ≤2 groups T test Wilcoxon Kruskal Wallis Friedman > 2 groups ANOVA
T-test Dependent samples t-test One sample t-test Independent samples t-test Sample Group 2 Sample Group 1 Sample A Sample B Sample Population Same group
One sample t-test Compare the mean of the sample [x̄] with a pre-specified value (population mean [µ]) Continuous Average score of medical students in UK universities = 72 We think that the average score of medical students in the University of Sheffield will be different H0 x̄ = µ x̄ = 72 H1 x̄ ≠ µ x̄ ≠ 72
Independent sample t-test Compare the mean between 2 independent groups [x̄1 , x̄2] Categorical (grouping) Continuous Average score of medical students between University of Sheffield & University of Leeds H0 x̄1 = x̄2 H1 x̄1 ≠ x̄2
Independent sample t-test Assumptions Normality Independent groups Equal variance between groups Group 1 Group 2
Independent sample t-test Why does variance matter? Differentmean-Equalvariance Equalmean-Equalvariance var.equal = T t- test Group 1 AssumesEqualvariance Group 2 Group 1 Group 2 ‘R’ Default Equalmean-Differentvariance Differentmean-Differentvariance Welch t- test AssumesDifferentvariance Group 1 Group 1 Group 2 Group 2
Dependent sample t-test Categorical (grouping) Also called paired t-test Continuous Compare the mean between 2 dependent groups [x̄, x̄’] Average score of medical students at University of Sheffield before & after a ‘course revision’ module Continuous H0 x̄ = x̄‘ H1 x̄ ≠ x̄‘ Long format Wide format
Choice of test NOT normally distributed Normally distributed Median (IQR) Mean ± SD Descriptives Significance tests Parametric tests Non-Parametric tests ≤2 groups T test Wilcoxon Kruskal Wallis Friedman > 2 groups ANOVA
Wilcoxon-test One-Sample Wilcoxon Signed Rank Test Wilcoxon Signed-Rank Test Wilcoxon– Mann–Whitney test Sample Group 2 Sample Group 1 Sample A Sample B Sample Population Same group
Choice of test NOT normally distributed Normally distributed Median (IQR) Mean ± SD Descriptives Significance tests Parametric tests Non-Parametric tests ≤2 groups T test Wilcoxon Kruskal Wallis Friedman > 2 groups ANOVA
ANOVA One-way ANOVA Repeated measures ANOVA Two-way ANOVA 1 categorical (grouping variable>2 levels) 1 numeric/continuous variable 2 categorical (grouping variables) 1 numeric/continuous variable Equivalent to dependant t-test But >2 repeated measures
One-way ANOVA Equivalent to independent t-test but for > 2 groups Categorical (grouping) Continuous Compare the mean between 3 or more independent groups [x̄1 , x̄2, , x̄3 ] Average score of medical students between University of Sheffield, University of Leeds and University of Manchester H0 x̄1 = x̄2 = x̄3 H1 x̄1 ≠ x̄2 ≠ x̄3
Two-way ANOVA 2 categorical (grouping variables) Categorical 1 (grouping 1) Categorical 2 (grouping 2) Continuous Average score of medical students between University of Sheffield, University of Leeds and University of Manchester AND between males & females
Repeated measures ANOVA Categorical (grouping) Equivalent to paired t-test but for >2 repeated measures Continuous Compare the mean between > 2 dependent groups [x̄, x̄’ , x̄’’] Average score of medical students at University of Sheffield for mid-term, term & final H0 x̄ = x̄‘ = x̄‘‘ H1 x̄ ≠ x̄‘≠ x̄‘‘ Long format Wide format
Post Hoc test Only done if ANOVA result is significant (p<0.05) Indicates the significant result was due to differences in which groups Sheffield ≠ Manchester Leeds ≠ Manchester
Choice of test NOT normally distributed Normally distributed Median (IQR) Mean ± SD Descriptives Significance tests Parametric tests Non-Parametric tests ≤2 groups T test Wilcoxon Kruskal Wallis Friedman > 2 groups ANOVA
Kruskal Wallis - Friedman Kruskal Wallis test Friedman test Equivalent to repeated measures ANOVA for non-parametric data Equivalent to one-way ANOVA for non-parametric data
Statistics for biological data Course Objectives Introduction to statistics 1. Contingency tables & testing for categorial variables 2. Normality testing & Descriptive statistics 3. Testing for continuous variables Lots of practice!