Download

1 / 25
250 likes | 271 Views
Algorithm for exploring patterns in clinical genomic data to identify commonalities and relationships between cases and controls, aiding disease etiology understanding and pathway evaluation.

E N D
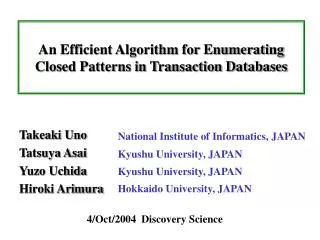
An Algorithm ForExploring Patterns InClinical Genomic Data Richard Mushlin and Aaron Kershenbaum IBM T.J. Watson Research Center
Some Questions • What do people with a disease (cases) have in common that people without the disease (controls) don’t? • How “exact” is the answer? • What does the answer tell us about the disease etiology?
Our Approach • Find patterns in cases • Compare frequencies with same patterns in controls • Score patterns • Find relationships between patterns • Evaluate effect of patterns on biological pathways
Find Patterns • Combination of • Brute force • Thresholds • Directed search
Bipartite Graph Representation “F1=a” P1 “F2=a” P2 “F2=b” “F3=a” P3 “F3=c” Feature values People
Find Maximal Bicliques • Biclique: • Subgraph of bipartite graph • All people are connected to all feature values • Maximal biclique: • Cannot add person to biclique without losing feature value • Cannot add feature value to biclique without losing people
Save Acceptable Candidates • Candidate is acceptable (so far) if: • Biclique [{S},{D}] is maximal • {S} has “enough” elements • {D} has “enough” elements • Score (figure of merit) is “good enough” • Thresholds for {S}, {D}, score, set as parameters • Candidates saved in priority queue by score
Compute Neighbor Set • For candidate C = [{Sc},{Dc}], neighbor set {Nc} is the set of feature values in the original data that has at least one person in {Dc} • For singleton candidate [{S1},{D1,D3}], the neighbor set is {S4, S5, S7, S9}
Expand Candidates • Pop “current best” candidate Co off priority queue • Create new candidates from neighbors {NCi} by taking unions and intersections: • SCi = {SCo} U {SNi} • DCi = {DCo} ∩ {DNi} • Save acceptable candidates in queue
F.O.M. And The Priority Queue • Various criteria can be used to calculate a figure of merit (score) • Working queue size set as parameter • Working queue is allowed to fill up • Buffer is emptied when trigger reached F.O.M.
F.O.M. And Search Strategy • The search strategy is embodied in the evaluation of the “<“ operator for bicliques • The candidate queue is prioritized in the same order as the scores • The scoring function can be externalized • The search strategy can be changed without changing the search machinery
Scoring Case/Control Problems Given Measured Derived
Scoring Example ( a * d ) Odds Ratio (OR) = ( b * c ) FOM = abs ( log ( OR ) )
Statistical Significance (a+b)! (c+d)! (Ncases)! (Ncontrols)! p = a! b! c! d! (Ntotal)! q = ∑ p, for all tables with same margins and better FOM FOMadj = FOM * ( 1 – q )
Structure Of The Output • Algorithm yields a collection of related patterns (bicliques) • Question of when to “lump” and when to “split” related patterns • Lattice structure helps us decide
Lattice (simplified) • A lattice can be represented as a graph with special properties (Hasse diagram) • In the context of bicliques, each node B is characterized by 2 sets: S and D • A directed edge exists from node B1 to B2 if and only if • S1 is a subset of S2 and • D2 is a subset of D1
Lattice Example Null; 1,2,3,4 B; 2,3,4 C; 1,3,4 A; 1,2,3 A,B; 2,3 A,C; 1,3 B,C; 3,4 C,D; 1,4 A,C,D; 1 A,B,C; 3 B,C,D; 4 A,B,C,D; Null
Lattice Score jump
SNP Lattice
“Reading” The Lattice Background context Small Ns Large Nd Low FOM Score jump +S -D Effect of adding S in the context of High FOM Children of may have better or worse scores, but are “similar” to +S’ -D’ +S” -D” Lower FOM Higher FOM Scores similar