Download
1 / 18
190 likes | 362 Views
SECTION III General Natural Resource Issues. Ch6: positive economics; how markets function in the case of natural resources Ch7: normative economics; public policy. Chapter 6 Markets and Efficiency. 1. Market Demand and Supply. Demand curve

E N D
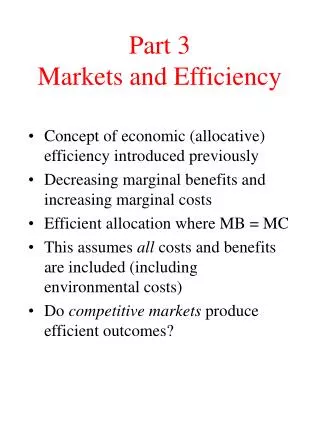
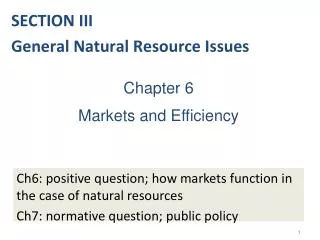
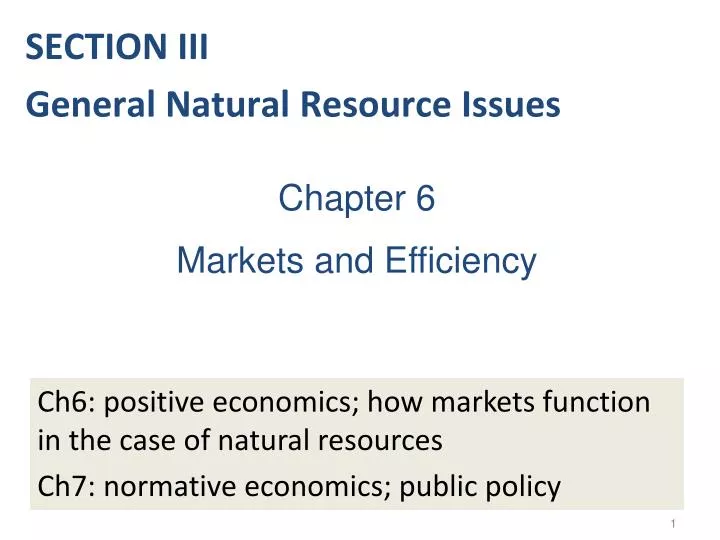
SECTION III General Natural Resource Issues Ch6: positive economics; how markets function in the case of natural resources Ch7: normative economics; public policy Chapter 6 Markets and Efficiency
1. Market Demand and Supply • Demand curve • downward slope illustrates diminishing marginal willingness to pay • It reflects consumers’ incomes, tastes, and other economic factors • Supply curve • upward slope reflects increasing marginal production costs • Its exact shape is related to input prices, technologies, etc.
2. Markets and Static Social Efficiency • If a market equilibrium means social efficiency, • then market demand curve = MSB curve: there are no sources of social value that are not registered by market participants themselves • and market supply curve = MSC curve: there are no sources of cost to members of society that are not registered in those private cost/supply curves
(a) External Costsa negative production externality • Consider a collection of paper mills located on a river • They produce paper: marginal supply curve is marginal private costs (MPC) curve • Paper mills emit residuals into the river which lead to damages suffered by downstream communities: downstream external costs (EC) • Marginal social costs (MSC) = MPC + EC • Socially efficient quantity and price are q* and p*; competitive market outcome is qm and pm (qm > q* , market quantity is too high; pm < p*, market price is too low) Page 91: Figure 6-3
(a) External Costsa negative production externality p 42 MSC = MPC + MEC S =MPC p* = 26 pm = 22 10 D = MPB = MSB 0 128 160 q of paper q* qm Review ECO324-Ch3
(b) External Costsa positive production externality $ MPC a MSC = MPC + MEC b MPB = MSB 0 q qm q* Review ECO324-Ch15; and pp.92-93 in our text
($ millions) MSC K p* = 175 MSB=MPB+MEB pm = 170 L MPB q 0 qm = 200 q* = 210 (c) External Benefitsa positive consumption externality Review ECO324-Ch15
(d) External Benefitsa negative consumption externality $ MSC MPB MSB = MPB + MEB 0 q q* qm Review ECO324-Ch15
Open-Access Resource • The resource that is open to unrestricted use by anyone who might wish to utilize it: ocean fishery, hunting, public parks… • “The Tragedy of the Commons” (Garrett Hardin, Science, Vol. 162, 1968, pp. 1243-1248): Open-access externality that leads to overuse of the resource is the diminution in the quality of the pasture as more and more animals are out on it • Page 95, Table 6-2, public beach: the fifth visitor reduces the value of the beach to the four already there, from $20 to $18 for each one
Open Access and the Dissipation of Resource Rent • Public beach example: efficient visitation level is 4 visitors; benefits – costs = $80 – $48 = $32 • $32 is a return attributable to the resource itself (the beach); this is the resource rent produced by the beach • If visitation level had risen to 8 people, then benefits – costs = $96 – $96 = $0; open access had led to the dissipation or disappearance of all natural resource rent
FYI Review ECO324 (slides 12-18) 5. Environmental Damage:A Negative Externality Chapter 3 Modeling Market Failure • Environmental economists are interested in externalities that damage the atmosphere, water supply, natural resources, and overall quality of life
FYI Modeling a Negative Environmental Externality • Define the market as refined petroleum • Assume the market is competitive • Supply is the marginal private cost (MPC) • Demand is the marginal private benefit (MPB) • Production generates pollution, modeled as a marginal external cost (MEC) • Problem: Producers (refineries) have no incentive to consider the externality • Result: Competitive solution is inefficient water pollution
FYI Finding a Competitive SolutionRefined Petroleum Market • S: P = 10.0 + 0.075Q • D: P = 42.0 - 0.125Q, where Q is in thousands of barrels per day • Since S is MPC and D is MPB, rewrite as MPC = 10.0 + 0.075Q MPB = 42.0 - 0.125Q (P means private) • Find the competitive solution and analyze
FYI Competitive Solution • Set MPB = MPC 42.0 - 0.125Q = 10.0 + 0.075Q • Solve: QC =160thousand; PC = $22per barrel (C means competitive) • Analysis: • This ignores external costs from contamination • QC is too high; PC is too low
FYI Finding a Socially Efficient SolutionRefined Petroleum Market • Let Marginal External Cost (MEC) = 0.05Q • Marginal Social Cost (MSC) = MPC + MEC • MSC = 10.0 + 0.075Q + 0.05Q =10.0 + 0.125Q • Marginal Social Benefit (MSB) = MPB + MEB • Assuming no external benefits, MEB= 0, so MSB = MPB • Set MSC = MSB --10.0 + 0.125Q = 42.0 - 0.125Q --Solving: QE =128thousand; PE = $26/barrel
FYI MSC, MPC, MPB Graph P ($ per barrel) Page 67 42 MSC = MPC + MEC S =MPC PE = 26 PC = 22 10 D = MPB = MSB 0 128 160 Q (thousands) QE QC
FYI • Results of negative externality --QC(160) is higher than QE(128), since the firm does not bear the full cost of its production, and so will produce more than the socially efficient quantity (overallocation of resources) --PC(22) is lower than PE(26), since MEC is not captured by market transaction