Download
1 / 24
240 likes | 400 Views
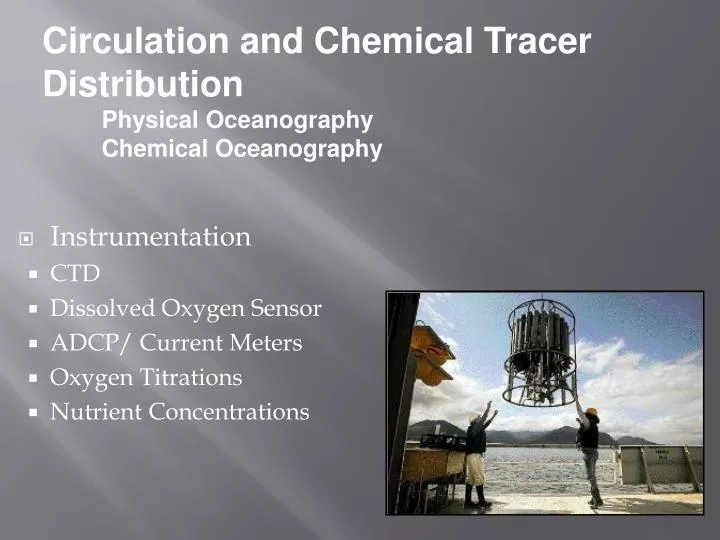
Circulation and Chemical Tracer Distribution Physical Oceanography Chemical Oceanography. Instrumentation CTD Dissolved Oxygen Sensor ADCP/ Current Meters Oxygen Titrations Nutrient Concentrations. Units. Temperature: °C

E N D
Circulation and Chemical Tracer Distribution Physical Oceanography Chemical Oceanography • Instrumentation • CTD • Dissolved Oxygen Sensor • ADCP/ Current Meters • Oxygen Titrations • Nutrient Concentrations
Units Temperature: °C Salinity: no units; defined by 1978 Practical Salinity Scale (PSU) Pressure: db (decibars) Density Density (ρ) is a function of T, S, and p ρ(4°C, 0, 1 atm) = 1 g cm-3 = 1000 kg m-3 Potential Density of Seawater (corrected for compressibility) ranges from 1022 kg m-3 to 1028 kg m-3 in the open ocean Sigma Theta (σθ) = ρ(T, S, 1 atm) - 1000 [kg m-3]
We prefer concentration Units of mol/kg Dissolved Oxygen Units?? Puget Sound Scientific Literature: mg/L, mg-at/L, mL/L, μmol/kg Conversion Factors: 1 mole O2 = 32 g O2 = 22.414 L O2 = 2 g-at O 1 L seawater = 1000 cm3 = (0.001 m3)×(density of SW) Density of SW [kg/m3] = 1000 + sigma theta Text
An estuary is... A place where river(s) meet the ocean that has surrounding land and a limited opening... Puget Sound is an estuary; it is connected to the Pacific Ocean through the Straits of Juan de Fuca. Coastal Plain or Drowned River Valley Estuary
Fjord estuaries • Sillblocks exchange of deep water with ocean • Little water movement below sill depth • Strong vertical stratification Fig 12.35
Schematic Diagram of the Flow in Puget Sound Admiralty Inlet Port Susan Saratoga Passage WHIDBEY BASIN Solid = Surface Dashed = Deep Estuarine Circulation: Surface Outflow, Deep Inflow Driven by river input, mixing, and deep water intrusions
PROCESSES THAT CONTROL CIRCULATION: --Wind Forcing --Density Stratification Freshwater inflow at the surface --Tides --Flushing events from the open ocean
Stratification How does it change from rivers to Main Basin? How does change in stratification affect biology?
Measured Currents are dominated by the tides Estuarine flow revealed only when tides are removed Tides ≈ 5-10 × Strength of Estuarine Flow
Current Meter Measurements in the Main Basin -- Averaged over the interval indicated -- With the Tidal currents removed Level of no motion?
Numerical Modeling 20 layers 350-m resolution in Puget Sound River flow - 15 major river, USGS Atmosphere - 6-hour avg from MM5 Eight tidal components
Water Residence Times Box Model (1992-2001) Numerical Model (2006)
Cycles of Phosphorus, Nitrogen, Carbon, Oxygen and Silica in Puget Sound waters Tracers of Biological Production and Respiration REDFIELD RATIOS: ∆P : ∆N : ∆C : ∆O21 : 16 : 106 : -153 For diatoms: NO3- : Si ratios: ∆N : ∆Si 1 : (1-3)
REDFIELD STOICHIOMETRY OF LIFE: P : N : C : O2 = 1 : 16 : 106 : 153 Dissolved Inorganic Phosphorus, DIP vs Dissolved Inorganic Nitrogen, DIN In the Ocean
Sections of Oxygen, Phosphate, and Nitrate in Whidbey Basin, Oce 220, 2010 O2 (μmol kg-1) PO43-(μmol kg-1) NO3-(μmol kg-1)
Nitrate : Phosphate ratios in Port Susan Compilation from recent data (Oce 220 , 2010) AOU (Apparent Oxygen Utilization) = [02sat] –[O2]
RATES: NET OXYGEN PRODUCTION -- PHOTOSYNTHESIS Oxygen Supersaturation in Puget Sound Surface waters Oce 220 2010 ( Percent Supersaturation)
RATES OF NET BIOLOGICAL OXYGEN PRODUCTION = ∆O2/ ∆C (153/106) X NET CARBON PRODUCTION (NCP) OXYGEN FLUX TO THE ATMOSPHERE ~ NET BIOLOGICAL O2 PRODUCTION FO2= - GO2 {[O2]-[O2]sat} The Gas Exchange Mass Transfer Coefficient, G, is a function of wind speed {[O2]-[O2]sat}
Rates of Respiration in Waters Below the Surface Oxygen Utilization Rate (OUR) = Respiration Rate = AOU / t t = time since water was at the surfaceIn Whidbey Basin deep watert = time since water came into the basin from outside RATES: NET O2 CONSUMPTION-- RESPIRATION
Knudsen’s Equations Water Balance: Tin + R = Tout Salt Balance: SinTin = SoutTout Solve for Tout: Tout = R×Sin/[Sin - Sout] Can add temporal variability, mixing between layers