Download

1 / 37
370 likes | 558 Views
“The fashion sector finds itself in an ongoing process of change.” KPMG, “Trends in Retailing 2005,” An Outlook for the Food, Fashion and Footwear Sectors. Global trends pressuring clothing retailers Price-cutting war Discount retailers help drive price down Concentration and consolidation

E N D
“The fashion sector finds itself in an ongoing process of change.”KPMG, “Trends in Retailing 2005,” An Outlook for the Food, Fashion and Footwear Sectors Global trends pressuring clothing retailers • Price-cutting war • Discount retailers help drive price down • Concentration and consolidation • Few large, globally-expanding retailers • Verticalization Clothing Retailing Report, Evgenia Sorokina et al., 2005
Clothing: Two Different Industries • Textile • Treating, manufacturing, and producing the • fibers, natural and “man-made” • Making the fabrics • Apparel—the focus of this presentation • Making fashionable clothes from textiles • Marketing, distributing, and selling those clothes • Collectively $330 billion industries • S&P’s Industry Survey for Apparel & Footwear, Sept. 2005
The Textile and Apparel Industries The Gap’s Business Components The Global Apparel Value Chain, U.N. Indus. Dvlp. Org., 2003
Globalization began about 40 years ago Consolidation—the 29 largest retailers have made up 98% of all U.S. apparel sales since the mid-1990’s “Mature” in the industry life cycle Historical Development Clothing Retailing Report, Evgenia Sorokina et al., 2005; The Global Apparel Value Chain, U.N. Indus. Dvlp. Org., 2003
The Apparel Industry is Competing for a Sliver of the “Basket of Goods” Typical Basket of Goods The Gap and its competitors are fighting for 4% of the pie—and it’s getting smaller CPI Report from BLS, Dec. 2004
Spending Less and Less on Apparel • Percentage of personal income spent on apparel continues to decline S&P’s Industry Survey for Apparel & Footwear, Sept. 2004
Who Sells Apparel Nowadays? S&P’s Industry Survey for Apparel & Footwear, Sept. 2004
The Cost of Making Clothes • Costs have been dropping every year • Material • Cotton prices dropped 35% in 1999-2003 • Synthetic fibers have dropped 28% • But now there are higher oil prices • Labor • The most significant cost component • Price per unit has also dropped • But costs should have fallen even more The Forces Shaping World Cotton Consumption After the Multi-fiber Arrangement, USDA, April 2005
Sources of the U.S.’ Apparel Imports Labor-intensive production has shifted to lower cost countries Current trend is textile and apparel jobs are migrating to S.E. Asia China has the lowest labor costs The segment tail is imports in 1990, imports in 2000 is where the country name appears U.N. Indus. Dvlp. Org., 2003
The Effect of Imports on U.S. Employment? More loss of U.S. jobs in apparel production S&P’s Industry Survey for Apparel & Footwear, Sept. 2004
Tariffs Have Skewed Production • The Multi-Fiber Agreement (“MFA”) has distorted world production and consumption • Complex 50-year agreement that ended on January 1, 2005 • Quotas on a country’s clothing exports • About 40% of quotas were exhausted every year • Retailers then purchased from others with worse C.A.—Nepal, Bangladesh, Sri Lanka • Distorted world production and fragmented trade S&P’s Industry Survey for Apparel & Footwear, Sept. 2005; The Multi-fiber Arrangement Strategic Sourcing Impact: The Private Perspective, October 2004
MFA • Purpose was to protect U.S. and EU textile and clothing producers • The cost of MFA to U.S. consumers was estimated at $80 billion annually • Tariffs 12 times higher than on other products • Post-MFA expectations: • Predicted reductions 50¢ to $2 per unit • Suppliers quoting 5 to 20% reductions • Shift to produce lower-value products, as prior quotas were for quantity not price S&P’s Industry Survey for Apparel & Footwear, Sept. 2004 & Sept. 2005
Demand and supply relocate production Exports shift to countries with comparative advantage But other relevant factors are quality, communication skills, political stability, etc. But safeguard provisions invoked with China May 2005 limited import after 64% surge Holds $1.31 billion imports to 7.5% growth up to 2008 EU took similar action in June 2005 The End of Quotas —Almost S&P’s Industry Survey for Apparel & Footwear, Sept. 2005
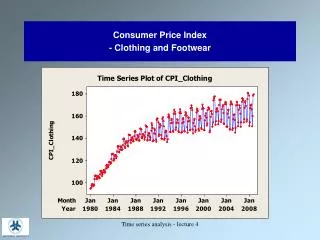
The Trend in Clothing Prices • Despite MFA tariffs, real clothing prices have continued to drop, particularly in the U.S. Lower-income countries had smaller price declines The Forces Shaping World Cotton Consumption After the Multi-fiber Arrangement, USDA, April 2005
A drop in income Supply reduces demand for apparel Initial equilibrium P1 P2 New equilibrium 2 D 1 D Q Q1 In the Short Run, Apparel Sales Plummet When Income Falls Decreases in income causes drops in clothing purchases of a greater percentage • In the 1998 Asian financial crises, urban incomes in South Korea dropped 15% • Clothing consumption then fell 33% Prices 0 Quantity Apparel had the largest decline of any expenditure category The Forces Shaping World Cotton Consumption After the Multi-fiber Arrangement, USDA, April 2005
Long-Run Effects of Clothing Purchases Are Less Pronounced • Clothing sales track with changes in income But purchases grow more slowly than income The Forces Shaping World Cotton Consumption After the Multi-fiber Arrangement, USDA, April 2005
The Weather and Apparel Sales • Clothing sales can correlate with weather Predicted bitter cold season → Warm instead → Discounted winter clothes → Result: lower profits • Vertical integration best solution S&P’s Industry Survey for Apparel & Footwear, Sept. 2004
Fashion Trends Affect Sales • Changing fashion is a sales driver • Generates consumer interest • Drives consumer traffic into apparel stores • Consumers pay full price for latest fashion • Enticed to buy other items when in store • Consumers, however, are hooked on bargains S&P’s Industry Survey for Apparel & Footwear, Sept. 2004
About Gap Inc. • Leading international specialty retailer offering clothing, accessories and personal care products for men, women, children and babies • 42nd largest global retailer * • More than 150,000 employees • Operates about 3,000 stores in the United States, the United Kingdom, Canada, France and Japan *2004 figure Source: www.gapinc.com, www.chainstoreage.com
The Gap’s Business Units Medium-price garments of good quality and constantly changing trends→ Low-price garments at acceptable quality→ Exceptional-quality garments at appropriate prices→ Quality garments targeted specifically to 35-year and older women→
2004 Gap Inc Revenue in Billions www.finance.yahoo.com
Gap Inc. Main Competitors www.finance.yahoo.com
Comparative Employment Figures www.finance.yahoo.com
Outlook for the Gap—Negatives • Increasing competition post-MFA as supply barriers have fallen • Facing ongoing declines in consumer spending on fashion • Recent history of fashion “flops” that has not turned around yet
Outlook for the Gap—Positives • Post MFA quota • ↓in labor costs & ↑efficiencies • More selective supply chain • Economies of scale • Vertically-integrated company • ↑ flexibility & ↑ efficiency • Quicker response to customers’ trends • More influence over supply chain & quality
Recommendations for the Gap • Exploit the Gap’s vertical integration • Reducing lead-time from idea to finished product in store • Reduce inventory turns • Tie market research on fashion trends to vertical advantages
Recommendations for the Gap • Continue globally expanding its store locations • Develop identity in new, growth economies such as China, Eastern Europe, and Russia • Invest in information technologies • Improve inventory mix, fast access to size and color trends, determine mark-down schedules, lean levels, replenish stock
Recommendations for the Gap • Acquire more brands with room to expand • The Gap and Old Navy are mature and do not resonate as strongly with consumers • New fashions into iconic brands • Forth & Towne’s • Consider mergers and acquisitions • Expansion into industrialized countries • Partnering for growth
Recommendations for the Gap • Expand products beyond low-margin apparel • Enhance fashion accessories • Continue to improve product to market timeframe • Reduce supplier base • Currently in 64 countries • Gain efficiency • Reduce exposure to exchange rate
Gap’s Risk Factors • Highly competitive, changing environment • Consumer spending patterns • Foreign business • IT system changes
Macroeconomic Factors • Inflation • Force majeure • Foreign exchange rates • US Factors - EU Factors - Japan Factors
Conclusion • GAP INC is a large player in the economy with over 160K employees • GAP INC sales has been following the GDP trend • GAP INC is heavily impacted by the state of the economy • Consumer spending • Interest rates • Inflation • Discretionary income