Download
1 / 1
10 likes | 90 Views
Stronger clustering, higher yield ( 0). Weaker clustering, lower yield ( ). 4/6 good chips. 2/6 good chips. A Cost Analysis Framework for Multi-core Systems with Spares. Saeed Shamshiri, Peter Lisherness, Sung-Jui Pan, and Kwang-Ting (Tim) Cheng

E N D
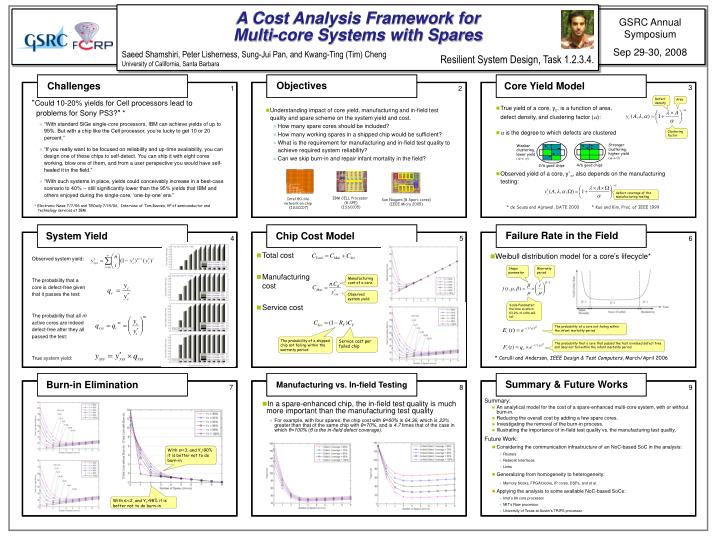
Stronger clustering, higher yield (0) Weaker clustering, lower yield ( ) 4/6 good chips 2/6 good chips A Cost Analysis Framework for Multi-core Systems with Spares Saeed Shamshiri, Peter Lisherness, Sung-Jui Pan, and Kwang-Ting (Tim) Cheng University of California, Santa Barbara Resilient System Design, Task 1.2.3.4. Objectives Challenges Core Yield Model 3 1 2 Defect density Area “Could 10-20% yields for Cell processors lead to problems for Sony PS3?” * • “With standard SiGe single-core processors, IBM can achieve yields of up to 95%. But with a chip like the Cell processor, you’re lucky to get 10 or 20 percent.” • “If you really want to be focused on reliability and up-time availability, you can design one of these chips to self-detect. You can ship it with eight cores working, blow one of them, and from a user perspective you would have self-healed it in the field.” • “With such systems in place, yields could conceivably increase in a best-case scenario to 40% -- still significantly lower than the 95% yields that IBM and others enjoyed during the single-core, ‘one-by-one’ era.” • True yield of a core, yc, is a function of area, defect density, and clustering factor (): • is the degree to which defects are clustered • Observed yield of a core, y’c, also depends on the manufacturing testing: • Understanding impact of core yield, manufacturing and in-field test quality and spare scheme on the system yield and cost. • How many spare cores should be included? • How many working spares in a shipped chip would be sufficient? • What is the requirement for manufacturing and in-field test quality to achieve required system reliability? • Can we skip burn-in and repair infant mortality in the field? Clustering factor defect coverage of the manufacturing testing IBM CELL Processor (8 SPE) (ISSCC05) Intel 80-tile network on chip (ISSCC07) Sun Niagara (8 Sparc cores) (IEEE Micro 2005) * Electronic News 7/7/06 and TGDaily 7/14/06, Interview of Tom Reeves, VP of semiconductor and technology services at IBM * de Sousa and Agrawal, DATE 2000 * Kuo and Kim, Proc. of IEEE 1999 Failure Rate in the Field System Yield Chip Cost Model 4 5 6 • Total cost • Manufacturing cost • Service cost • Weibull distribution model for a core’s lifecycle* Observed system yield: The probability that a core is defect-free given that it passes the test: The probability that all m active cores are indeed defect-free after they all passed the test: True system yield: Shape parameter Warranty period Manufacturing cost of a core Observed system yield Scale Parameter: the time at which 63.2% of units will fail The probability of a core not failing within the infant mortality period The probability of a shipped chip not failing within the warranty period Service cost per failed chip The probability that a core that passed the test is indeed defect free and does not fail within the infant mortality period * Carulli and Anderson, IEEE Design & Test Computers, March/April 2006 Summary & Future Works Burn-in Elimination Manufacturing vs. In-field Testing 7 8 9 Summary: • An analytical model for the cost of a spare-enhanced multi-core system, with or without burn-in. • Reducing the overall cost by adding a few spare cores. • Investigating the removal of the burn-in process. • Illustrating the importance of in-field test quality vs. the manufacturing test quality. Future Work: • Considering the communication infrastructure of an NoC-based SoC in the analysis: • Routers • Network Interfaces • Links • Generalizing from homogeneity to heterogeneity: • Memory blocks, FPGA blocks, IP cores, DSPs, and et al. • Applying the analysis to some available NoC-based SoCs: • Intel’s 80 core processor • MIT’s Raw processor • University of Texas at Austin’s TRIPS processor • In a spare-enhanced chip, the in-field test quality is much more important than the manufacturing test quality • For example, with four spares, the chip cost with θ=60% is 64.36, which is 23% greater than that of the same chip with θ=70%, and is 4.7 times that of the case in which θ=100% (θ is the in-field defect coverage). With s>=3, and Yc>90% it is better not to do burn-in With s>=2, and Yc>98% it is better not to do burn-in