Download
1 / 28

E N D
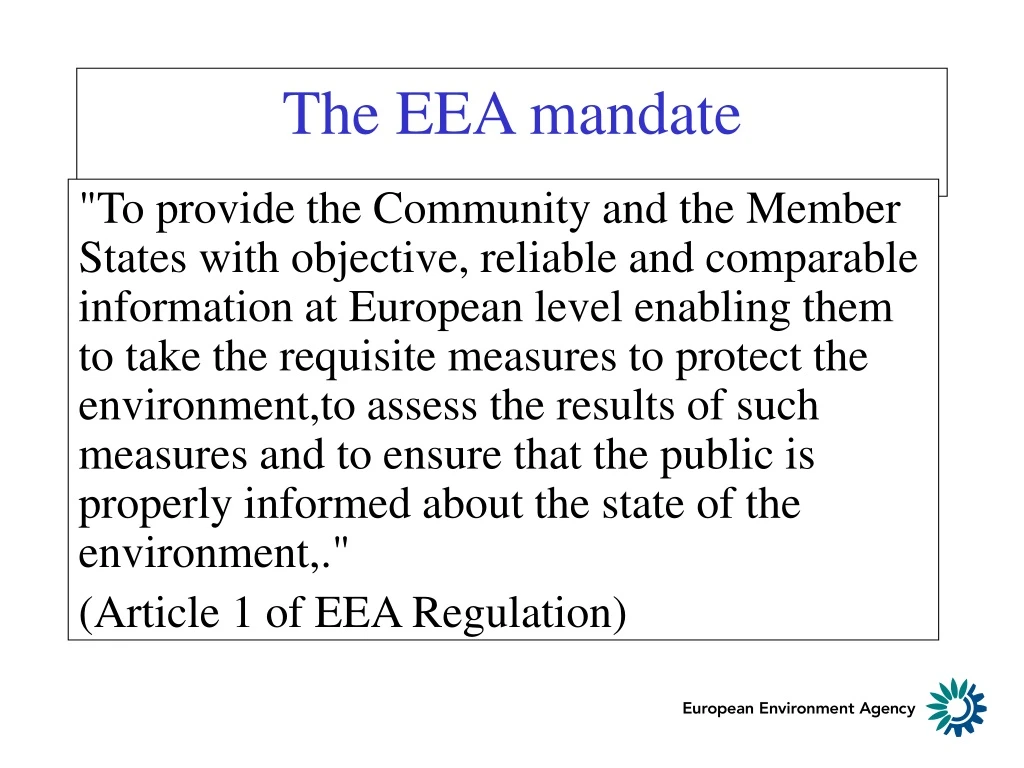
"To provide the Community and the Member States with objective, reliable and comparable information at European level enabling them to take the requisite measures to protect the environment,to assess the results of such measures and to ensure that the public is properly informed about the state of the environment,." (Article 1 of EEA Regulation) The EEA mandate
1. To provide objective, reliable, comparable information enabling the Community and Member States to frame, identify, prepare, implement, monitor, evaluate and assess the results of sound and effective environmental policy measures and legislation, and to publish reports on state, trends and prospects for the environment every five years supplemented by indicator reports focusing upon specific issues; to ensure that the public is properly informed on the state of the environment 2. For this purpose: To collect, record, collate, process, analyse and assess data on the quality, pressures, sensitivity and state of the environment, and develop a reference center 3. To establish and co-ordinate a European environment information and observation network (EIONET) Main Tasks of the EEA
4.“To assist the monitoring of environmental measures through appropriate support for reporting requirements….with the aim of coordinating reporting” 5.“To advise individual Member States, upon their request…..on the development, establishment and expansion of their systems for the monitoring of environmental measures” (resources permitting) New duties from 1999…
From monitoring…. ….to reporting M D I A R
MDIAR stands for: R: Reporting A: Assessment I: Information D: Data M: Monitoring M: Monitoring D: Data I: Information A: Assessment R: Reporting
Water: Reporting Are EU policies contributing to reductions in organic pollution levels in European rivers?
Water: Assessment “Increased industrial and agricultural production, coupled with more of the population being connected to sewerage, has resulted in increases in discharges of organic waste into surface water in most European countries since the 1940s. Over the past 15 to 30 years, however, biological treatment of waste water has increased (see section 11.3), and organic discharges have consequently decreased across most of Europe. The result is that many rivers are now well oxygenated. During the 1990s the BOD levels improved by around 20-30% in both EU and Accession Country rivers. The improvement in EU countries was largely due to the Urban Waste Water Treatment Directive, which increased the level of treatment of waste water. “ (Source: Environmental Signals 2002)
Water: Information Annual median concentration of BOD and ammonium in European rivers Source: EEA, EUROWATERNET
WATER Spreadsheets DEMs BASE WWW Access • Monitoring data/metadata (S and I) from MS • Associated D and P data • Aggregated comparable European data/statistics • Disseminated validated aggregated data to public Water: Data
EWN Guidelines for the Water Framework Directive? Eurowaternet Guidelines for Rivers, Lakes, Groundwaters, Water Quantity Water: Monitoring
Sectorial Integration Process Strategies Reporting mechanisms 6th Environmental Action Programme: Thematic strategies Business as Usual: Framework Directives EU Programmes Plans Strategies SOE Reporting Chain Policy Objectives and Targets INDICATOR FRAMEWORKS Themes: Air Pollution, Climate change, Water, Waste, Resource Use, Biodiversity Sectors: Transport, Energy, Agriculture, Fisheries, Tourism DATA FLOWS FROM COUNTRIES Environment: EEA, Eurostat, International Conventions Socio-economic: Eurostat, OECD, UNSO, FAO, IEA EUSDS Synthesis Report TERM EERM AERM DG Env Annual Report Eurostat PIPs Project Environmental Signals EU Headline Indicators Standardised Reporting Directive
Environmental Themes Climate change Air pollution Water Stress Biodiversity Terrestrial Environment Waste and Material Flows Sectoral Integration Transport Energy Agriculture Tourism Fisheries EEA Indicator Frameworks
Covers freshwaters, transitional, coastal and marine waters Issues to be addressed: Water quantity Eutrophication and organic pollution Hazardous substances Ecological quality Number of indicators: Not yet finalised Likely to be some 50-60 in total Core set for water
Nutrients in Rivers Figure 1: Trends in the median of the stations annual average total phosphorus concentrations (g P/l) and nitrate concentrations (mg N/l) in EU15 countries, 1990 to 2000, and Phare Accession countries, 1992-2000. Number of stations in brackets. Data collected by EUROWATERNET from Denmark, Germany, France and the UK. Denmark, Germany, France, and the UK, and Slovenia, Poland, Latvia, Lithuania, Hungary, Estonia and Bulgaria.
Mar/April – Bilaterals with EEA clients May – Draft proposals for EEA core sets End May – Presentation at NFP Meeting June-Aug – formal written procedure with EEA Management Board, EIONET, Commission and NGOs September – finalise EEA core sets of indicators October – further presentations to NFP/EIONET meeting and EEA Scientific Committee November – final proposals for approval to EEA Management Board December – DGEnv proposal for Directive on reporting ? Indicator consultation process
EU policy focus – from SDS to 6th EAP to Strategies to Framework Directives (3 corridors) Detailed analysis (IEA) using theme/sector frameworks of progress against policy objectives Focused data collection and policy relevant indicator reports = streamlining!! Systematic approach to indicators and data flows = improved data quality and assessment to support policy EEA Added Value
Length - around 50 pages Contents – issues as covered by core set Consultation on Factsheets – Summer 2002 Consultation on Assessment – September – October 2002 Pre-publication – November 2002 Final publication – December 2002/January 2003 Water Indicator Report 2002
Is to provide representative information on Rivers, lakes, reservoirs, groundwater bodies Concept is being extended to transitional, coastal and marine waters (Guidelines being developed in 2002) Through the progressive implementation of: Basic network – to provide a general overview Impact network – to answer specific questions regarding policies, individual substances or pressures Fully representative networks – statistically robust to enable European-wide and inter-regional comparisons Aim of EUROWATERNET
A non-statutory reporting obligation on EEA member countries EUROWATERNET is a ‘priority data flow’ - agreed by the NFP/EIONET group and EEA Management Board Information provided is NOT for legal compliance assessment (Commission’s job) Information can be used to assess the effectiveness of policies (e.g. are the objectives of Directives being met?) EUROWATERNET
Based on existing national and international monitoring networks Avoids duplication of reporting where possible Assists in improving existing data flows Will be consistent with improvements to national monitoring and information networks as a result of Water Framework Directive Assists capacity building in countries through guidelines, visits and shared learning EUROWATERNET
The database for managing at European level annual data flows from countries Contains at the end of 2001 information on: around 3 000 river stations in 29 countries, more than 1 100 lake stations in 24 countries, around 300 groundwater bodies in 20 countries Web access already available for groundwaters; available soon for rivers and lakes Waterbase
Eurowaternet For EEA indicators Stratification by size, driving force to deliver comparable data Nutrients, hazardous substances, biology etc Physical characteristics – mean depth, altitude, catchment area, soil type Proxy pressures – population density, land use Eurostat/OECD JQ For OECD SOE reports Largest rivers and lakes selected by countries. Nutrients, hazardous substances, biology etc Physical characteristics – none Proxy pressures - none EWN and Eurostat JQ