Download
1 / 1
10 likes | 122 Views
Surface Current Observations in the Lower Chesapeake Bay: Mean Circulation Patterns and Modes Larry P. Atkinson 1 , Teresa Garner 1 , Jose Blanco 1 , Chris Paternostro 2 , Pat Burke 2.

E N D
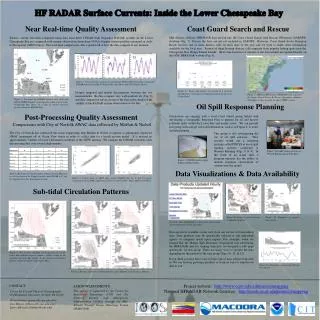
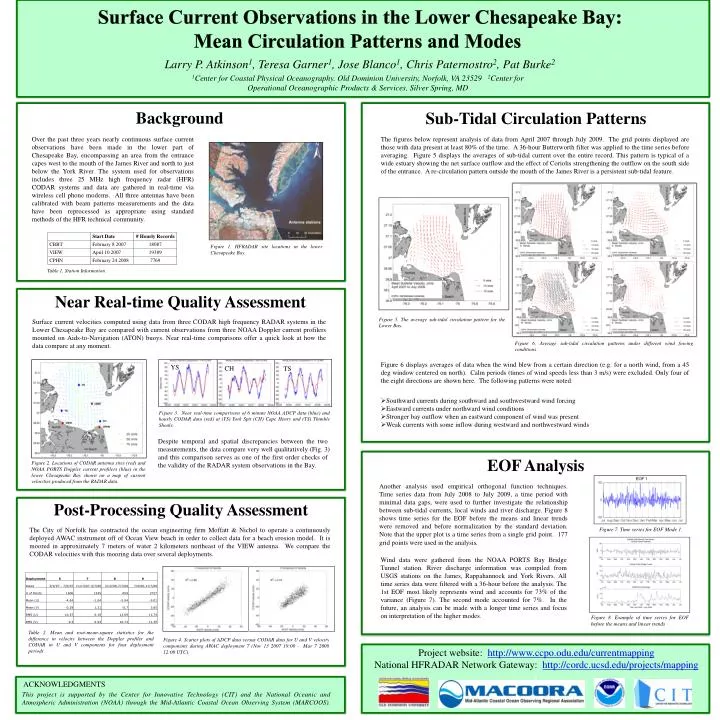
Surface Current Observations in the Lower Chesapeake Bay: Mean Circulation Patterns and Modes Larry P. Atkinson1, Teresa Garner1, Jose Blanco1, Chris Paternostro2, Pat Burke2 1Center for Coastal Physical Oceanography. Old Dominion University, Norfolk, VA 23529 2Center for Operational Oceanographic Products & Services, Silver Spring, MD Background Sub-Tidal Circulation Patterns YS CH TS The figures below represent analysis of data from April 2007 through July 2009. The grid points displayed are those with data present at least 80% of the time. A 36-hour Butterworth filter was applied to the time series before averaging. Figure 5 displays the averages of sub-tidal current over the entire record. This pattern is typical of a wide estuary showing the net surface outflow and the effect of Coriolis strengthening the outflow on the south side of the entrance. A re-circulation pattern outside the mouth of the James River is a persistent sub-tidal feature. Over the past three years nearly continuous surface current observations have been made in the lower part of Chesapeake Bay, encompassing an area from the entrance capes west to the mouth of the James River and north to just below the York River. The system used for observations includes three 25 MHz high frequency radar (HFR) CODAR systems and data are gathered in real-time via wireless cell phone modems. All three antennas have been calibrated with beam patterns measurements and the data have been reprocessed as appropriate using standard methods of the HFR technical community. Figure 3. Near real-time comparisons of 6 minute NOAA ADCP data (blue) and hourly CODAR data (red) at (YS) York Spit (CH) Cape Henry and (TS) Thimble Shoals. Figure 1. HFRADAR site locations in the lower Chesapeake Bay. Table 1. Station Information. Near Real-time Quality Assessment Figure 5. The average sub-tidal circulation pattern for the Lower Bay. Surface current velocities computed using data from three CODAR high frequency RADAR systems in the Lower Chesapeake Bay are compared with current observations from three NOAA Doppler current profilers mounted on Aids-to-Navigation (ATON) buoys. Near real-time comparisons offer a quick look at how the data compare at any moment. Figure 6. Average sub-tidal circulation patterns under different wind forcing conditions. • Figure 6 displays averages of data when the wind blew from a certain direction (e.g. for a north wind, from a 45 deg window centered on north). Calm periods (times of wind speeds less than 3 m/s)were excluded. Only four of the eight directions are shown here. The following patterns were noted: • Southward currents during southward and southwestward wind forcing • Eastward currents under northward wind conditions • Stronger bay outflow when an eastward component of wind was present • Weak currents with some inflow during westward and northwestward winds Despite temporal and spatial discrepancies between the two measurements, the data compare very well qualitatively (Fig. 3) and this comparison serves as one of the first order checks of the validity of the RADAR system observations in the Bay. EOF Analysis Figure 2. Locations of CODAR antenna sites (red) and NOAA PORTS Doppler current profilers(blue) in the lower Chesapeake Bay shown on a map of current velocities produced from the RADAR data. Another analysis used empirical orthogonal function techniques. Time series data from July 2008 to July 2009, a time period with minimal data gaps, were used to further investigate the relationship between sub-tidal currents, local winds and river discharge.Figure 8 shows time series for the EOF before the means and linear trends were removed and before normalization by the standard deviation. Note that the upper plot is a time series from a single grid point. 177 grid points were used in the analysis. Post-Processing Quality Assessment The City of Norfolk has contracted the ocean engineering firm Moffatt & Nichol to operate a continuously deployed AWAC instrument off of Ocean View beach in order to collect data for a beach erosion model. It is moored in approximately 7 meters of water 2 kilometers northeast of the VIEW antenna. We compare the CODAR velocities with this mooring data over several deployments. Figure 7. Time series for EOF Mode 1. Wind data were gathered from the NOAA PORTS Bay Bridge Tunnel station. River discharge information was compiled from USGS stations on the James, Rappahannock and York Rivers. All time series data were filtered with a 36-hour before the analysis. The 1st EOF most likely represents wind and accounts for 73% of the variance (Figure 7). The second mode accounted for 7%. In the future, an analysis can be made with a longer time series and focus on interpretation of the higher modes. Figure 8. Example of time series for EOF before the means and linear trends Table 2. Mean and root-mean-square statistics for the difference in velocity between the Doppler profiler and CODAR in U and V components for four deployment periods. Figure 4. Scatter plots of ADCP data versus CODAR data for U and V velocity components during AWAC deployment 7 (Nov 13 2007 19:00 - Mar 7 2008 12:00 UTC). 0 Project website: http://www.ccpo.odu.edu/currentmapping National HFRADAR Network Gateway: http://cordc.ucsd.edu/projects/mapping ACKNOWLEDGMENTS This project is supported by the Center for Innovative Technology (CIT) and the National Oceanic and Atmospheric Administration (NOAA) through the Mid-Atlantic Coastal Ocean Observing System (MARCOOS).