Download
1 / 26
300 likes | 452 Views
Reviewing Sine Waves. Honors Physics. The graph of y = sin x. The graph of y = sin x is a cyclical curve that takes on values between –1 and 1. We say that the range of the sine curve is Each cycle (wave) corresponds to one revolution (360 or 2 radians) of the unit circle.

E N D
Reviewing Sine Waves Honors Physics
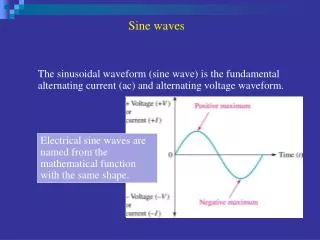
The graph of y = sin x The graph of y = sin x is a cyclical curve that takes on values between –1 and 1. • We say that the range of the sine curve is Each cycle (wave) corresponds to one revolution (360 or 2 radians) of the unit circle. • We say that the periodof the sine curve is 2.
Take a look at the graph of y = sin x: (one cycle) Some points on the graph:
Using Key Points to Graph the Sine Curve Once you know the basic shape of the sine curve, you can use the key points to graph the sine curve by hand. The five key points in each cycle (one period) of the graph are the intercepts, the maximum point, and the minimum point.
The graph of y = cos x The graph of y = cos x is also a cyclical curve that takes on values between –1 and 1. The range of the cosine curve is The periodof the cosine curve is also 2.
Take a look at the graph of y = cos x: (one cycle) Some points on the graph:
Using Key Points to Graph the Cosine Curve Once you know the basic shape of the cosine curve, you can use the key points to graph the cosine curve by hand.
Characteristics of y= sin x and y = cos x • Domain:____________ • Range:_____________ • Amplitude:The amplitude of the sine and cosine functions is half the distance between the maximum and minimum values of the function. The amplitude of both y= sin x and y = cos x is _______. • Period: The length of the interval needed to complete one cycle. The period of both y= sin x and y = cos x is ________.
Transformations of y = sin x and y = cos x • Reflections over x-axis • Vertical Stretches or Shrinks • Horizontal Stretches or Shrinks/Compression • Vertical Shifts • Phase shifts (Horizontal shifts/displacement)
I. Reflections over x-axis Example: Note: Calculator Mode must be in Radians
II.Vertical Stretchingor Compression (Amplitude change) Example
Example The graph of a function y = asinxor y = acosxis shown.Determine the equation of the specific function.
III. Horizontal Stretching or Shrinking/Compression(Period change) Example
y x
Graphs of Examples State the amplitude and period for each function. Then graph one cycle of each function by hand. Verify using your graphing calculator.
IV. Phase Shifts Example
IV. Phase Shifts (continued) Example
y x Example: Determine the amplitude, period, and phaseshift of the function. Then sketch the graph of the function by hand.
y x Example: List all of the transformations that the graph of y = sin x has undergone to obtain the graph of the new function. Graph the function by hand.
y x Example: List all of the transformations that the graph of y = sin x has undergone to obtain the graph of the new function. Graph the function by hand.
Modeling Using a Sinusoidal Function On a Florida beach, the tides have water levels about 4 m between low and high tides. The period is about 12.5 h. Find a cosine function that describes these tides if high tide is at midnight of a given day.