Download
1 / 41
410 likes | 661 Views
Revenue Cycle Improvement and Impact of ACA. February 17-18 th , 2014 Winter Education Event. Key Revenue Cycle Management Impact Areas. Key Components of Revenue Cycle Management – “ Where Does it Happen?”. “Front End”. “Middle”. “Back-End”.

E N D
Revenue Cycle Improvement and Impact of ACA February 17-18th, 2014 Winter Education Event
Key Components of Revenue Cycle Management – “Where Does it Happen?” “Front End” “Middle” “Back-End” Traditionally: Revenue cycle has been thought of in modular and geographic silos
Revenue Cycle: Comprehensive – End to End Management “Front End” “Middle” “Back-End” • Comprehensive , focused on pre-service and time of service • All stakeholders are identified and linked regardless of reporting relationships and geographic location • Consistent processes, tools, targets and tracking metrics
Payor Opportunity: Couple A/R Performance with Denial Write-offs Metric Calculate opportunity and link to financial statements Denials % of NR Net AR Days Gross Days - DNFB Critical target and progress metrics % A/R > 180 DFD % A/R > 365 DFD
Payor Denial Opportunity: Focus on Preventable Losses $6,750 (1.35% of NR) $3M $3,750 (.75% of NR) * Typical mid-size health system
Payor Hidden Denials Rampant - Reporting Virtually Non-Existent/Inaccurate Weak Capture of Actual $ Denied but Limited Detail Reporting Good Capture of Actual $ Denied but Limited Detail Reporting Accurate Capture of Actual $ Denied and Robust Detail Reporting Polling Question: What Best Describes Your Health System’s Current Denial Tracking Situation?
Payor Polling Question: What Best Describes Your Health System’s Current Denial Tracking Situation?
Payor Where to Focus Initially
Uninsured Example Health Example System Health System Historical Avg Benchmark 18% 15% 12% 5% 7% 5% 5% 6% 4% 75% 65% 95% 55% 50% 60% Uninsured Scorecard Calculate opportunity and link to financial statements Uncompensated Care % of NR Self Pay % of GR Self Pay Bad Debt % of NR Critical target and progress metrics Self Pay Screening Rate Self Pay Conversion Rate Implementation of a comprehensive, automated screening process is key to reducing Uncompensated Care
Uninsured • Medicaid • Other Paying Solutions • 20% Comprehensive Screening Program Improves Charity Classification, Hidden Paying Sources and Cash Collections • Partial Charity • 15% Financial Counselor’s place patients into categories at time of service and address all steps needed to close account • Charity Screen All Health System Uninsured (IP, OP, Phy, ED, etc.) • 55% • Ability to Pay • Uncooperative • 10%
Uninsured Components of Uncompensated Care: Impact of Robust Screening Process on Uncompensated Care $16M Residual Bad Debt • $4M actual cash yield on residuals and true self pay collections Self Pay Bad Debt • $4.8M net ($12M gross) cash yield derived from “found payor solutions” for uninsured Charity Prompt Pay and Uninsured Discount Mid-Size HS Benchmark % of net revenue 15.2% 12% Increased cash from payors and patients while appropriately classifying charity patients for community benefit impact
Self Pay Example Health Example System Health System Historical Avg Benchmark 8.5% 8.0% 5.5% 40% 30% 70% 6% 5% 7% 0.5% 0.3% 1.5% 40% 30% 40% Self Pay – Residual/ Cash Scorecard Calculate opportunity and link to financial statements Bad Debt % of NR Residual Cash Yield Self Pay Cash Yield Critical Target and Progress Metrics POS Cash as a % of NR POS Cash as a % of Total Cash Improving collections at Point of Service is critical to decreasing bad debt write-offs
Self Pay Set Targets and Stair-step to High Performer Status Example Opportunity Range: Mid-size Hospital Payment Collection Composition Benchmark Opportunity Percent Comparison • Current Balance1 • Bad Debt 2 • Patient Payments3 • $1.1M • $1.2M • $1.2 – $2.3M • 70% • 65% • 40% • Residual • 2% • 58% • 40% • [Hospital] yield • Target yield • High Performer • $0.2M • $0.5M • $0.5 – $0.7M • 8% • Self-pay • 6% • 91% • 4% • 6% • 4% Potential impact: $1.7 – 3.0M • [Hospital] yield • Target yield • High Performer 1 typical mid-size health system
Self Pay Don’t Forget Prior Balance Opportunity at POS Prior balance traffic Weekly average1, $ Millions Prior balance potential Annual, $ Millions • 20% of collections will come from obtaining and rebilling proper insurance 2.0 2.1 Rebills 0.4 Prior balance 1.2 • Collections will come from a variety of methods and will take time to ramp up 1.7 Cash Bad debt 0.8 • Best Practice: 2% of opportunity collected / rebilled annually Avg Wk Annual 2.0% 1 typical mid-size health system
Self Pay Focus on Residual Collections
Revenue Capture Assess Proficiency in Revenue Capture Late Charge Reduction Automated Charge Audit Typical Opportunity 1% of NR Strategic Pricing Documentation and Coding Department Charge Reconciliation
Cost to Collect Focus on Key Areas to Reduce Cost to Collect Vendor Review - Renegotiate Automation and Tech Optimization 5% - 20% of RCM Expense Opportunity Centralize Functions Review Sourcing: In vs Out Shift Resources to FE
Impact of the Affordable Care Act on Revenue Cycle Management
Exchange Enrollment Will Come From Both the Uninsured and Commercially-Insured Populations Private Health Exchange Commercial (Group) CurrentlyUninsured Public Health Exchange Commercial (Non-Group)
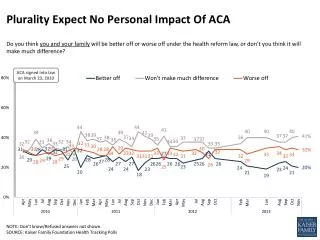
Increase in residuals ……Patient Responsibility • Increased complexity of claim submission • Increased complexity of payment methodologies Three Major Factors to Plan For
Tackle Increased Residuals at Point of Service: Transition from “wholesale” to “retail” collection mentality
Polling Question:How much of your organization’s current commercial patient population do you expect to shift to public exchanges over the next five years? • None • Less than 10% • 10% to 25% • 25% to 50% • Greater than 50% • Unsure
Polling Question:How much of your organization’s current commercial patient population do you expect to shift to public exchanges over the next five years? • None • Less than 10% • 10% to 25% • 25% to 50% • Greater than 50% • Unsure
Low Early Penalties May Slow Public Exchange Enrollment by the Uninsured Penalty as a Percentage of Income1 Flat Dollar Penalty per Person & Family2 = Individual = Family The penalty for not obtaining coverage will be the greater of a flat dollar amount or a percentage of income, unless certain exemptions are met3 1) Penalty applied to income above income tax filing threshold (roughly $10K for individuals and $20K for families in 2012). 2) Flat dollar penalty is indexed to inflation after 2016. 3) Some individuals may be exempt from penalties based on religion, citizenship, income, time noninsured, access to affordable coverage, etc. Source: Kaiser Family Foundation: The Requirement to Buy Coverage Under the Affordable Care Act. www.healthreform.kff.org.
Public Exchange Uptake Among the Uninsured Likely to Vary Considerably by State Note: Other key factors include the size of the illegal immigrant population and whether a state decides to expand Medicaid. Sources: Gold J.: “Worries Mount About Enrolling Consumers in Federally Run Insurance Exchanges.” Kaiser Health News, Apr. 7, 2013; Citigroup Exchange conference call, Apr. 8, 2013.
Collections Will Be a Challenge Due to Expected Preference for Bronze and Silver Plans Standardized Deductible Levels by Plan California Health Exchange Silver Bronze Silver High Deductible No Deductible • Low-income enrollees are likely to choose bronze or silver plans • Sicker enrollees may prefer the lower out-of-pocket spending of (subsidized) silver plans • Actual out-of-pocket expenses will depend on provider charity policies • Providers should educate uninsured on comparative risks of plans Note: 1) Hospital care not subject to deductible. 2) Medical deductible. 3) Deductible for medical and drugs. Income eligibility ranges are for individuals. Source: Covered California. Available at www.coveredca.com.
The Role of Hospitals in Establishing Coverage CHA White Paper in Brief • Expert guidance on improving health coverage for the uninsured • Implementation specifics of the ACA • The role of hospitals for expanded coverage • Eight proven outreach and enrollment strategies for hospitals • Proactive enrollment in coverage will directly impact the hospital’s bottom line in year one – plan/ carrier choice will matter • Hospitals will play a crucial role in education and enrollment assistance • State, local, and federal resources may be available to hospitals • Can leverage existing resources and best practices in place today
Key Thoughts on a Post-Reform Optimal Revenue Cycle • Focus on Scale: Centralize, Consolidate or Outsource • Ramp up staff, technology , processes and policies to effectively collect pre-service or point of service • Transition RCM resource investments to the “front” • Invest in additional education and resources related to uninsured financial counseling • Eliminate Silos: Manage “Front to Back” and incorporate/link to clinical revenue cycle functions such as documentation , clinical denials and quality • Institute a performance management culture – set targets and track results
Revenue Cycle: Assessment of Comprehensive – End to End Management • Typical range of opportunity: 2 to 6% of net revenue • Usually some “quick wins” but full opportunity takes significant focus and 2-3 years to realize • Largest opportunities tend to be “front end” related • Improving clean/accurate registration and insurance verification %s • Screening of uninsured patients for hidden solutions • Point of Service (POS) collection process • Root cause denial improvement Identify Opportunities…. Set Targets…. Monitor Progress…. Insist on Accountability!
Kimberly Neese, Senior Vice President Kimberly Neese is a Senior Vice President of Kaufman Hall, with leadership responsibilities related to the firm’s Strategic Cost Management practice. She assists hospitals and health systems in assessing their operational performanceand developing effective plans that target margin improvement through sustainablecost reduction and revenue improvement. She has broad expertise in developing and leading large-scale operational cost and revenue improvement projects, consolidations, physician/hospital joint ventures, and other financial and operational initiatives. With more than 25 years of healthcare experience, Ms. Neese most recently was an executive in McKinsey and Company’s Objective Health Division. Prior to this, she was Vice President with a national revenue cycle healthcare group, working with large health systems nationwide. In addition, Ms. Neese has extensive provider experience, having served as Senior Vice President and Chief Financial Officer of St. Mary's Health System, a subsidiary of Ascension Health, the nation's largest nonprofit health system. During her tenure there, she led the organization in developing a 10-year master facility and financial strategic plan, culminating in the opening of a new facility. Prior to this, she had various leadership roles in the finance and strategic planning groups of St. Mary's and other healthcare organizations. Ms. Neese received a Bachelor's of Science in Accounting from the University of Southern Indiana. Contact Information: Kimberly Neese Senior Vice President Kaufman, Hall & Associates, Inc. 5202 Old Orchard Road, Suite N700 Skokie, IL 60077 847.441.8780, ext. 271 kneese@kaufmanhall.com