Download
1 / 14
140 likes | 154 Views
Learn how to construct frequency tables and histograms, and understand their importance in analyzing data. Explore examples and find out the common mistakes to avoid.

E N D
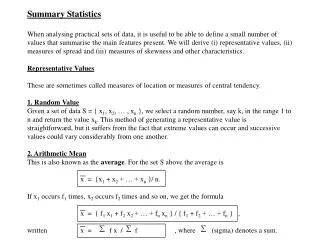
Reporting Frequency Frequency Tables Histograms
What is a Frequency Table? • A Frequency table is a table that lists each item in a data set with the number of times it occurs.
Construct a Frequency Table (tally sheet) 7, 10, 10, 9, 8, 9, 7, 4, 3, 7, 10, 4, 8, 9, 6, 7, 10 Enter the data value into the 1st column
Construct a Frequency Table (tally sheet) 7, 10, 10, 9, 8, 9, 7, 4, 3, 7, 10, 4, 8, 9, 6, 7, 10 Enter a tally for each entry.
Construct a Frequency Table (tally sheet) Count the tallies and put the total for each value in the frequency column 1 2 1 4 2 3 4
Making a Line plot • x x • x x x • x x x x x • x x x x x x x What is the range? 7 3 4 5 6 7 8 9 10
What is a Histogram? • A histogram is a bar graph with no spaces between the bars. The height of each bar shows the frequency of data within that interval. The intervals of a histogram are of equal size and do not overlap.
Histogram Class Test Scores Frequency Test Scores
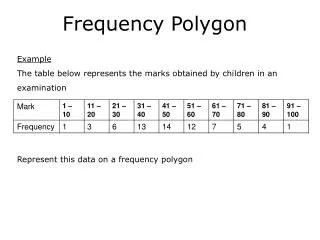
Histograms 95 flashlights are tested until they fail. The table gives the times taken ( hours ) until failure. Find 2 or more things wrong with the histogram which represents the data in the table.
Histograms Answer: Time taken for 95 components to fail • There is no title. • There are no units on the x-axis. Time to failure (Hours)
Histograms are used to show the frequency of data. Very similar to bar graphs, but use intervals on the X axis. Bars do touch. Histograms have a title. Histograms have two axes which are labeled. Histogram
Reporting Frequency Frequency Tables Histograms