Download
1 / 89
960 likes | 1.08k Views
This guide introduces key statistical concepts for non-statisticians, covering descriptive and inferential statistics, hypothesis testing, p-values, confidence intervals, and multivariate analysis. It explains the importance of understanding statistics, types of errors, sample sizes, and the role of statistics in decision-making.

E N D
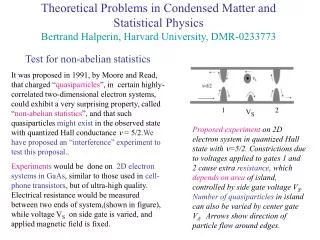
Statistics for non-statisticians Marco Pavesi Lead Statistician Liver Unit – Hospital Clínic i Provincial Ferran Torres Statistics and Methodology Support Unit. Hospital Clínic Barcelona Biostatistics Unit. School of Medicine. Universitat Autònoma Barcelona (UAB)
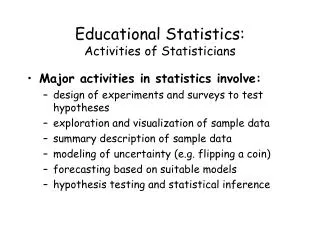
Outline Why Statistics? Descriptive Statistics. Populations and Samples. Type of errors Inferential Statistics. Hypothesis testing Statistical errors p-value Confidence Intervals Multiplicity issues. Type of tests. Sample size Multivariate analysis. More on p-values Conclusion: “little shop of horrors”
Inducción y Verdad Bertrand Russell presents… The inductivist turkey
Troubles for the plain researchers: Induction and statistics ARE NOT a method to get a sort of mathematical demonstration of Truth The results observed for a population sample are not necessarily true for the whole population
Smart turkeys / researchers… • …are aware that the relevance (weight) of statistical inferences always depends on the sample size
Smart turkeys / researchers… • …do know that we can only model /estimate the real world with a specific approximation error.
Smart turkeys / researchers… • …understand that true hipotheses do not exist, and we can only reject or keep a hypothesis based on the available evidence
What is statistics ? • “I know (I’m making the assumption) that these dice are fair: what is the probability of always getting a 1 in 15 runs?“ ==> Probability mathematics • “I have got always a 1 in 15 runs. Are these dice fair ?” ==> Inferential STATISTICS
Why is Statistics needed? Statistics tells us whether events are likely to have happened simply by chance Statistics is needed because we always work with sample observation (variability) and never with populations Statistics is the only mean to predict what is more likely to happen in new situations and helps us to make decisions
Population and Samples Sample Study Population Target Population
Random vs Sistematic error True Value 130 150 170 01 02 03 04 05 Example: Systolic Blood Pressure (mm Hg) Systematic (Bias) Random True Value 130 150 170 01 05 02 03 04
What Statistics? • Descriptive Statistics • Position statistics (central tendency measures): mean, median • Dispersion statistics: variance, standard deviation, standard error • Shape statistics: symmetry, skewness and kurtosis measures.
The mean and the median 1,3,3,4,6,13,14,14,18 6 1,3,3,4,6,13,14,14,17,18 6 - 13 Median=(6+13)/2=9.5 Arithmetic mean (average): Median: (50% of sample individuals have a value higher than or equal to the median) • Unlikely the median, the mean is affected by outliers • Especially relevant for specific distributions (survival times) Mean 1 Mean 2 New outlier Median 1 Median 2
Dispersion measures The Variance is the mean of squared differences from the distribution mean: • The Standard Deviation is the square root of the Variance: • The Standard Error is generally expressed as the ratio between the Variance and the sample size: • It is considered as the true SD of the population mean (or parameter) SE = σ2 / N
Inference & tests • Inferential Statistics • Draw conclusions (inferences) from incomplete (sample) data. • Allow us to make predictions about the target population based on the results observed in the sample • Are computed in hypothesis testing • Examples • 95%CI’, t-test, chi square test, ANOVA, regression
Basic pattern of statistical tests Based on the total number of observations and the size of the test statistic, one can determine the P value.
How many noise units? Test statistic & sample size (degrees of freedom) convert to a probability or P Value.
Overall hypothesis testing flow chart Test Statistics value Corresponding P-value (from known distribution) Comparison with significance level (previously defined) P < α P >= α Reject null hypothesis Keep null hypothesis
The role of statistics “Thus statistical methods are no substitute for common sense and objectivity. They should never aim to confuse the reader, but instead should be a major contributor to the clarity of a scientific argument.” The role of statistics. Pocock SJ . Br J Psychiat 1980; 137:188-190 23
Extrapolation Study Results Sample Inferential analysis Statistical Tests Confidence Intervals Population “Conclusions”
Statistical Inference Statistical Tests=> p-value Confidence Intervals 25
Valid samples? Population Likely to occur Invalid Sample and Conclusions Unlikely to occur
P-value The p-value is a “tool” to answer the question: Could the observed results have occurred by chance*? Remember: Decision given the observed results in a SAMPLE Extrapolating results to POPULATION *: accounts exclusively for the random error, not bias p < .05 “statistically significant” 27
A intuitive definition • The p-value is the probability of having observed our data when the null hypothesis is true • Steps: • Calculate the treatment differences in the sample (A-B) • Assume that both treatments are equal (A=B) and then… • …calculate the probability of obtaining a magnitude of at least the observed differences, given the assumption 2 • We conclude according the probability: • p<0.05: the differences are unlikely to be explained by random, • we assume that the treatment explains the differences • p>0.05: the differences could be explained by random, • we assume that random explains the differences
HYPOTHESIS TESTING • Testing two hypotheses • H0: A=B (Null hypothesis – no difference) • H1: A≠B (Alternative hypothesis) • Calculate test statistic based on the assumption that H0 is true (i.e. there is no real difference) • Test will give us a p-value: how likely are the collected data if H0 is true • If this is unlikely (small p-value), we reject H0
RCT from a statistical point of view Treatment A Randomisation Treatment B (control) 1 homogeneous population 2 distinct populations
RCT Sample Population
Statistical significance/Confidence ? A>B p<0.05 means: “I can conclude that the higher values observed with treatment A vs treatment B are linked to the treatment rather to chance, with a risk of error of less than 5%”
Factors influencing statistical significance • Difference • Variance (SD) • Quantity of data Signal Noise(background) Quantity
P-value • A “very low” p-value do NOT imply: • Clinical relevance (NO!!!) • Magnitude of the treatment effect (NO!!) With n or variability p • Please never compare p-values!! (NO!!!)
P-value STAT REPORT A “statistically significant” result (p<.05) tells us NOTHING about clinical or scientific importance. Only, that the results were not due to chance. A p-value does NOT account for bias only by random error
THE BASIC IDEA Statistics can never PROVE anything beyond any doubt, just beyond reasonable doubt!! … because of working with samples and random error
Type I & II Error & Power • Type I Error (a) • False positive • Rejecting the null hypothesis when in fact it is true • Standard: a=0.05 • In words, chance of finding statistical significance when in fact there truly was no effect • Type II Error (b) • False negative • Accepting the null hypothesis when in fact alternative is true • Standard: b=0.20 or 0.10 • In words, chance of not finding statistical significance when in fact there was an effect
Type I & II Error & Power • Power • 1-Type II Error (b) • Usually in percentage: 80% or 90% (for b =0.1 or 0.2, respectively) • In words, chance of finding statistical significance when in fact there is an effect
95%CI • Better than p-values… • …use the data collected in the trial to give an estimate of the treatment effect size, together with a measure of how certain we are of our estimate • CI is a range of values within which the “true” treatment effect is believed to be found, with a given level of confidence. • 95% CI is a range of values within which the ‘true’ treatment effect will lie 95% of the time • Generally, 95% CI is calculated as • Sample Estimate ± 1.96 x Standard Error
Interval Estimation A probability that the population parameter falls somewhere within the interval. Sample statistic (point estimate) Confidence interval Confidence limit (lower) Confidence limit (upper)
Superiority study Control better Test better IC95% d < 0 - effect d = 0 No differences d > 0 + effect
Superiority study Control better Test better IC95% d < 0 - effect d = 0 No differences d > 0 + effect
Lancet 2005; 365: 1591–95 • To say it colloquially, • torture the data until they speak... 45
Torturing data… Investigators examineadditional endpoints, manipulate group comparisons, do manysubgroup analyses, and undertakerepeated interim analyses. Investigators shouldreport all analytical comparisons implemented. Unfortunately, they sometimes hide the complete analysis, handicapping the reader’s understanding of the results. Lancet 2005; 365: 1591–95 46
Design Conduction Results 47
Multiplicity K independent hypothesis : H01 , H02 , ... , H0K S significant results ( p<a ) Pr (S 1 | H01 H02 ... H0K = H0.) = 1 - Pr (S=0|H0.) = 1- (1 - a)K 48
Sources of multiplicity in RCT Multiple assessment criteria (variables) Multiple times of assessment (repeated measurements) Multiple inspections (interim analyses) Multiple comparisons (more than two treatments) Multiple subsets and subgroups 49