Download
1 / 22
230 likes | 305 Views
Learn how to load and epoch continuous EEG data, plot ERP images, group ERPs, sort images, plot with multiple subjects, and enhance ERP images with Matlab scripting. Practice trial separation and visualization to improve understanding.

E N D
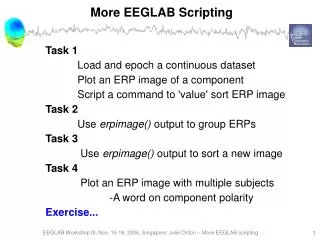
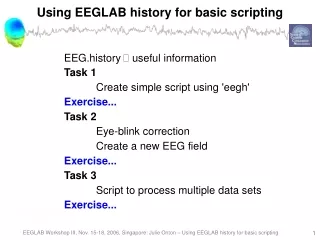
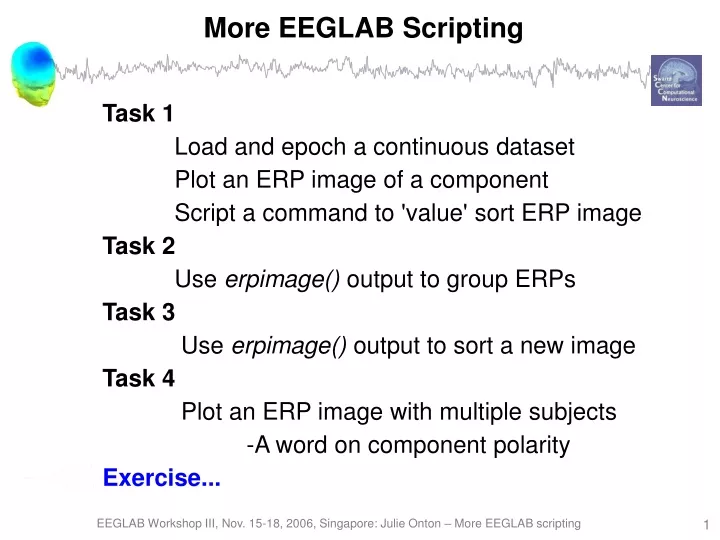
More EEGLAB Scripting Task 1 Load and epoch a continuous dataset Plot an ERP image of a component Script a command to 'value' sort ERP image Task 2 Use erpimage() output to group ERPs Task 3 Use erpimage() output to sort a new image Task 4 Plot an ERP image with multiple subjects -A word on component polarity Exercise... EEGLAB Workshop III, Nov. 15-18, 2006, Singapore: Julie Onton – More EEGLAB scripting
More EEGLAB Scripting Task 1 Load and epoch a continuous dataset Plot an ERP image of a component Script a command to 'value' sort ERP image Task 2 Use erpimage() output to group ERPs Task 3 Use erpimage() output to sort a new image Task 4 Plot an ERP image with multiple subjects -A word on component polarity Exercise... EEGLAB Workshop III, Nov. 15-18, 2006, Singapore: Julie Onton – More EEGLAB scripting
Task 1: Load dataset and epoch EEGLAB Workshop III, Nov. 15-18, 2006, Singapore: Julie Onton – More EEGLAB scripting
Task 1: Reject noisy epochs using auto-rejection EEGLAB Workshop III, Nov. 15-18, 2006, Singapore: Julie Onton – More EEGLAB scripting
Task 1: Plot ERP image from gui EEGLAB Workshop III, Nov. 15-18, 2006, Singapore: Julie Onton – More EEGLAB scripting
Task 1: Retrieve erpimage() call Command executed by pop_erpimage: erpimage( EEG.icaact([8], :), ones(1, EEG.trials)*EEG.xmax*1000, … linspace(EEG.xmin*1000, EEG.xmax*1000, EEG.pnts),'Comp. 8', 10, 1 , … ’yerplabel','','topo', { EEG.icawinv(:,8) EEG.chanlocs EEG.chaninfo },… 'erp','cbar'); data sortvar EEG.times title smooth/decimate Plotting options/scalp map Plot ERP and colorbar How do I adapt this command to include more erpimage() options? '>> help erpimage' EEGLAB Workshop III, Nov. 15-18, 2006, Singapore: Julie Onton – More EEGLAB scripting
Task 1: Using help command to build script EEGLAB Workshop III, Nov. 15-18, 2006, Singapore: Julie Onton – More EEGLAB scripting
Task 1: ERP image sorted by activation value Optionally sort input epochs: 'valsort'-[startms endms direction] Sort data on (mean) value between startms and (optional) endms. Direction is 1 or -1. If -1, plot max-value epoch at bottom [outdata,outvar,outtrials,limits,axhndls,… erp,amps,cohers,cohsig,ampsig,outamps,… phsangls,phsamp,sortidx,erpsig] = … erpimage(data, sortvar, times, 'title',… avewidth, decimate, flag1,arg1,...); %%%% VARIABLES %%%%%%%%%%%%%%%%% comp1 = 8; % Comp number to plot data = squeeze(EEG.icaact(comp1,:,:)); sortvar = []; startms = 580; % ms endms = 620; % ms smoothby = 1; %%%% PLOT ERPIMAGE %%%%%%%%%%%%%%%% figure; [outdata,outvar, outtrials,limits, axhndls, erp, … amps, cohers, cohsig, ampsig, outamps, phsangls, … phsamps, sortidx, erpsig] … = erpimage( data, sortvar, EEG.times, … ‘’, smoothby, 1, ‘valsort’, [startmsendms]); EEGLAB Workshop III, Nov. 15-18, 2006, Singapore: Julie Onton – More EEGLAB scripting
More EEGLAB Scripting Task 1 Load and epoch a continuous dataset Plot an ERP image of a component Script a command to 'value' sort ERP image Task 2 Use erpimage() output to group ERPs Task 3 Use erpimage() output to sort a new image Task 4 Plot an ERP image with multiple subjects -A word on component polarity Exercise... EEGLAB Workshop III, Nov. 15-18, 2006, Singapore: Julie Onton – More EEGLAB scripting
Task 2: Separate trials using erpimage() output lotrials = outdata(:, 1:120); medtrials = outdata(:,121:240); hitrials = outdata(:,241:end); figure; sbplot( 3, 1, 1) plot(EEG.times, mean(lotrials,2), ‘b-’); sbplot( 3, 1, 2) plot(EEG.times, mean(medtrials,2),‘g-’); sbplot( 3, 1, 3) plot(EEG.times, mean(hitrials,2), ‘r-’); Objective: Group and plot trials with low, middle and high amplitude ERPs EEGLAB Workshop III, Nov. 15-18, 2006, Singapore: Julie Onton – More EEGLAB scripting
Task 2: Plotting ERPs in Matlab lotrials = outdata(:, 1:120); medtrials = outdata(:,121:240); hitrials = outdata(:,241:end); figure; sbplot( 3, 1, 1) plot(EEG.times, mean(lotrials,2), ‘b-’); sbplot( 3, 1, 2) plot(EEG.times, mean(medtrials,2),‘g-’); sbplot( 3, 1, 3) plot(EEG.times, mean(hitrials,2), ‘r-’); Find maximum range EEGLAB Workshop III, Nov. 15-18, 2006, Singapore: Julie Onton – More EEGLAB scripting
Task 2: More Matlab plotting... lotrials = outdata(:, 1:120); medtrials = outdata(:,121:240); hitrials = outdata(:,241:end); figure; sbplot( 3, 1, 1) plot(EEG.times, mean(lotrials,2), ‘b-’); set(gca,’ylim’,[-1 2]); sbplot( 3, 1, 2) plot(EEG.times, mean(medtrials,2),‘g-’); set(gca,’ylim’,[-1 2]); sbplot( 3, 1, 3) plot(EEG.times, mean(hitrials,2), ‘r-’); set(gca,’ylim’,[-1 2]); EEGLAB Workshop III, Nov. 15-18, 2006, Singapore: Julie Onton – More EEGLAB scripting
Task 2: More Matlab plotting... lotrials = outdata(:, 1:120); medtrials = outdata(:,121:240); hitrials = outdata(:,241:end); figure; sbplot( 3, 1, 1); hold on; plot(EEG.times, mean(lotrials,2), ‘b-’); set(gca,’ylim’,[-1 2]); plot([-1000 2000],[0 0], ‘k:’); plot([0 0],[-1 2],’k-’); title(‘Low ERP trials’); sbplot( 3, 1, 2); hold on; plot(EEG.times, mean(medtrials,2),‘g-’); set(gca,’ylim’,[-1 2]); plot([-1000 2000],[0 0], ‘k:’); plot([0 0],[-1 2],’k-’); title(‘Mid ERP trials’); sbplot( 3, 1, 3); hold on; plot(EEG.times, mean(hitrials,2), ‘r-’); set(gca,’ylim’,[-1 2]); plot([-1000 2000],[0 0], ‘k:’); plot([0 0],[-1 2],’k-’); title(‘High ERP trials’); EEGLAB Workshop III, Nov. 15-18, 2006, Singapore: Julie Onton – More EEGLAB scripting
More EEGLAB Scripting Task 1 Load and epoch a continuous dataset Plot an ERP image of a component Script a command to 'value' sort ERP image Task 2 Use erpimage() output to group ERPs Task 3 Use erpimage() output to sort a new image Task 4 Plot an ERP image with multiple subjects -A word on component polarity Exercise... EEGLAB Workshop III, Nov. 15-18, 2006, Singapore: Julie Onton – More EEGLAB scripting
Task 3: Use sort index to sort a new ERP image %%%% VARIABLES %%%%%%%%%%%%%%%%% comp1 = 8; data = squeeze(EEG.icaact(comp1,:,:)); sortvar = []; startms = 580; endms = 620; smoothby = 1; %%%% PLOT ERPIMAGE %%%%%%%%%%%%%%%% figure; [outdata,outvar, outtrials,limits, axhndls, erp, … amps, cohers, cohsig, ampsig, outamps, phsangls, phsamps … sortidx, erpsig] = erpimage( data, sortvar, EEG.times, … ‘’, smoothby, 1, ‘valsort’, [startmsendms]); EEGLAB Workshop III, Nov. 15-18, 2006, Singapore: Julie Onton – More EEGLAB scripting
Task 3: Index definition >> my_numbers = [101,102,103,104,105,106,107,108,109,110]; my_numbers = 101 102 103 104 105 106 107 108 109 110 >> new_order = [8,2,5,1,10,9,4,6,3,7]; % similar to sortidx >> my_numbers(new_order) ans = 108 102 105 101 110 109 104 106 103 107 EEGLAB Workshop III, Nov. 15-18, 2006, Singapore: Julie Onton – More EEGLAB scripting
Task 3: Using sort index to sort a new ERP image %%%% VARIABLES %%%%%%%%%%%%%%%%% comp1 = 8; data = squeeze(EEG.icaact(comp1,:,:)); sortvar = []; startms = 580; endms = 620; smoothby = 1; %%%% PLOT ERPIMAGE %%%%%%%%%%%%%%%% figure; [outdata,outvar, outtrials,limits, axhndls, erp, … amps, cohers, cohsig, ampsig, outamps, phsangls, … phsamps,sortidx, erpsig] = erpimage(data,sortvar,… EEG.times,‘’,smoothby, 1,‘valsort’,[startmsendms]); %%%% NEW ERPIMAGE %%%%%%%%%%%%%%%% %%%% Sort by previous sort order %%%%%%%%% comp2 = 16; data2 = squeeze(EEG.icaact(comp2,:, sortidx)); minfrq = 9; % specify freq range for maxfrq = 12; % amplitude plot smoothby = 20; figure; [outdata,outvar, outtrials,limits, axhndls, erp, amps, … cohers, cohsig, ampsig, outamps, phsangls,phsamps, sortidx2, erpsig] … = erpimage( data2, sortidx, EEG.times, int2str(comp2),… smoothby, 1, ‘coher’, [minfrqmaxfrq.01],’plotamps’); Objective: Use sort order (sortidx) from ' valsort ' of comp1 to create a new ERP image of another component with the same sort order EEGLAB Workshop III, Nov. 15-18, 2006, Singapore: Julie Onton – More EEGLAB scripting
More EEGLAB Scripting Task 1 Load and epoch a continuous dataset Plot an ERP image of a component Script a command to 'value' sort ERP image Task 2 Use erpimage() output to group ERPs Task 3 Use erpimage() output to sort a new image Task 4 Plot an ERP image with multiple subjects -A word on component polarity Exercise... EEGLAB Workshop III, Nov. 15-18, 2006, Singapore: Julie Onton – More EEGLAB scripting
Task 4: Collect and plot data across subjects % Load two epoched datasets, from two different subjects %%%% VARIABLES %%%%%%%%%%%%%%%%% %Create a cell array with comps of interest plotcomps{1}= [10]; %subject 1 plotcomps{2}= [6]; %subject 2 sortvar = []; smoothby = 10; %%%% COLLECT DATA %%%%%%%%%%%%% data =zeros(0,0); forsubj = 1:length(plotcomps) [EEG ALLEEG CURRENTSET] = eeg_retrieve(ALLEEG,subj); scalefac = sqrt(mean(EEG.icawinv(:,plotcomps{subj}).^2)); %root mean square (RMS) data = [datasqueeze(EEG.icaact(plotcomps{subj},:,:))*scalefac]; end; %%%% PLOT ERPIMAGE %%%%%%%%%%%%%%%% figure; [outdata,outvar, outtrials,limits, axhndls, erp, amps, cohers, cohsig, ampsig, outamps, phsangls, phsamps, sortidx, erpsig] … = erpimage( data, sortvar, EEG.times, 'Component Cluster ERPimage’,smoothby , 1); OOPS! EEGLAB Workshop III, Nov. 15-18, 2006, Singapore: Julie Onton – More EEGLAB scripting
Task 4: Dealing with orientation Activation/scalp map polarity is arbitrary (!) -There IS an absolute orientation for each ELECTRODE when back-projected… -But you have to determine WHICH scalp location interests you Therefore, 1) pick one activation orientation 2) orient all subjects the same way data =zeros(0,0); for subj = 1:length(plotcomps) [EEG ALLEEG CURRENTSET] = eeg_retrieve(ALLEEG,subj); scalefac = sqrt(mean(EEG.icawinv(:,plotcomps{subj}).^2)); if subj == 2 data = [datasqueeze(EEG.icaact(plotcomps{subj},:,:))*scalefac *-1];%reverse else data = [datasqueeze(EEG.icaact(plotcomps{subj},:,:))*scalefac]; end; end; EEGLAB Workshop III, Nov. 15-18, 2006, Singapore: Julie Onton – More EEGLAB scripting
Task 4: Correctly oriented activations %%%% PLOT ERPIMAGE %%%%%%%%%%%%%%%% figure; [outdata,outvar, outtrials,limits, axhndls, erp, … amps, cohers, cohsig, ampsig, outamps, phsangls, … phsamps,sortidx, erpsig] = erpimage(data, sortvar,… EEG.times,‘Cluster comps’, smoothby, 1, ‘erp’, ‘cbar’); EEGLAB Workshop III, Nov. 15-18, 2006, Singapore: Julie Onton – More EEGLAB scripting
Exercise • Load '.../data/faces_3.set' • Epoch on 'object' and 'face' stimuli • Remove any noisy epochs • 'valsort' the ERP of component 10 at 150 ms • Intermediate: • Collect sortidx output • Apply sort order to an activation time course ERP image of component 4(try different smoothing factors) • Advanced: • Include RTs (use 'eegh' from gui command) in 'valsort' plot above and determine mean/std of RTs for low, mid and high amplitude trials. • Is there an effect of ERP size on RT? EEGLAB Workshop III, Nov. 15-18, 2006, Singapore: Julie Onton – More EEGLAB scripting