Download
1 / 38
380 likes | 393 Views
This webinar discusses the analysis and use of census tract-level poverty data in public health, including recommended measures, examples of analyses, and special considerations. It also explores the importance of using area-based socioeconomic status measures to describe health disparities.

E N D
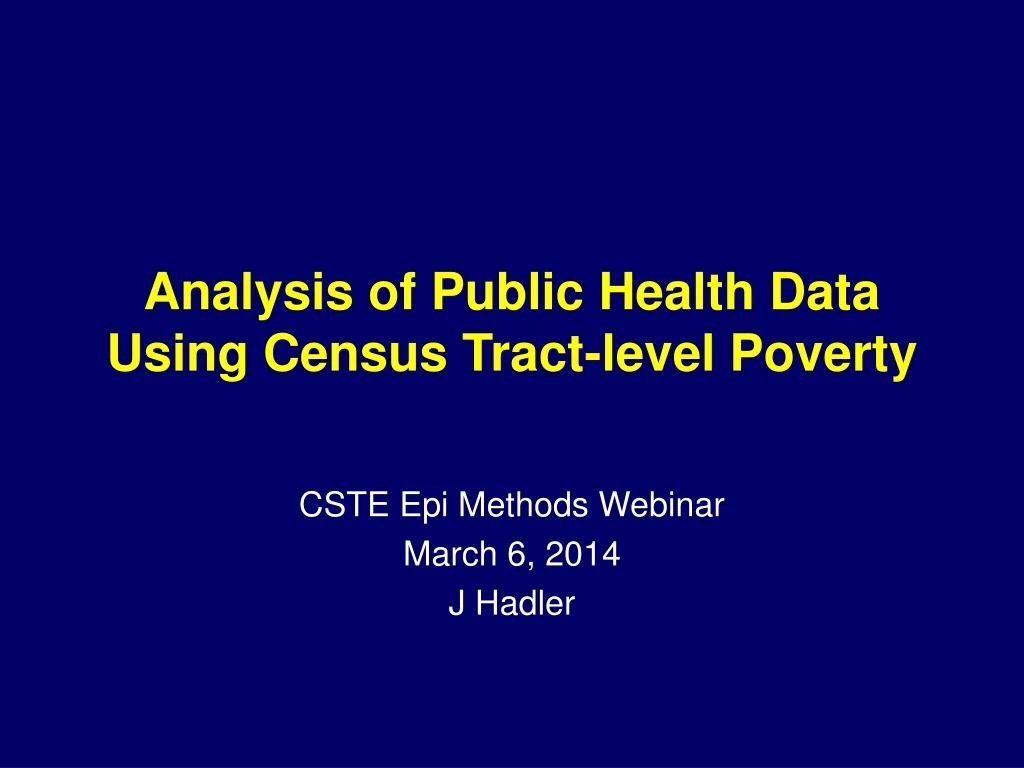
Analysis of Public Health Data Using Census Tract-level Poverty CSTE Epi Methods Webinar March 6, 2014 J Hadler
Outline Rationale Public Health Disparities Geocoding Project (PHDGP) • Recommended standard Area-based SES measure • Examples of recent analyses Principles of analysis and steps involved Special considerations • choice of poverty cut-points, geocoding, selection of source of census tract poverty, denominators, age-adjustment Current use of this method by public health agencies Conclusions
Rationale 1 Describing health disparities and monitoring progress in reducing them has been a national priority (HP 2010 and 2020). Disparities usually described in terms of differences in rates or rate-ratios by various demographic groups: age, sex, race-ethnicity, place, SES Health inequities occur when disparities/differences between groups occur because the group(s) with high rates are at a social or economic disadvantage. Haven’t been standard variables to describe disparities by place or by SES
Rationale 2 Major variable used to describe health disparities/inequities by SES has been race-ethnicity. Use of race/ethnicity as a major means to describe disparities has some severe limitations not always available >20 official race/ethnic groups difficult to interpret – disparities are only sometimes genetic or cultural; mostly race-ethnic disparities reflect SES differences Not easy to intervene based on race alone May be disparities within race-ethnic groups
Rationale 3 • US has no recommended SES measure for routine collection, analysis and display of surveillance data – race-ethnicity is a very unsatisfying surrogate. • Geocoding accessibility and ease have made it possible to use area-based SES measures where have street address or ZIP code. • PHDGP already laid groundwork
Public Health Disparities Geocoding Project 1 • Harvard-based lead by Nancy Krieger, ~1998 - 2004 • Recognized potential in public health data for analysis using ABSES: street addresses available • Also recognized value of ABSES measures • “Place” (neighborhood) can have a profound influence on health. • ABSES is more than a surrogate for individual SES • Explored wide range of health outcomes using MA and RI data from 1990 using different area sizes and SES indices • Found ABSES measures described disparities as big or bigger than those by race/ethnicity and usually described disparities within race/ethnic groups.
Public Health Disparities Geocoding Project 2 • Found ABSES measures described disparities as big or bigger than those by race-ethnicity and usually described disparities within race/ethnic groups. • Recommended use of census tract level percentage of residents living below federal poverty level for routine data analysis. • <5%, 5-9.9%, 10-19.9%, >20% • “Painting a truer picture of US socioeconomic and racial/ethnic health inequalities: The PHDGProject”. Am J Public Health 2005; 95: 312-323. • http://www.hsph.harvard.edu/thegeocodingproject/
Connecticut EIP • Gain experience using census tract poverty level to describe health disparities and differences between groups. • Began to analyze surveillance data routinely as part of the EIP in ~2009. • Invasive pneumococcal disease* • Influenza hospitalizations (pediatric*, adult*) • Cervical cancer precursors (CIN 2,3; AIS)* • Foodborne bacterial pathogens (campylobacter**, STEC, salmonella) • Varicella incidence and hospitalizations * published; ** submitted
Incidence of influenza-associated hospitalizations by census tract poverty level, Children 0-17 years, NH County, CT, 2003/04 -2009/10 Incidence per 100,000 person-years <5% 5-9.9% 10-19.9% 20+% Census tract poverty level AJPH 2011;101:1785
Ratio of highest to lowest census tract-level poverty incidence of influenza-associated hospitalizations by year, Children 0-17 yrs, CT, 2003/04 – 2009/10 Incidence ratio H1N1 AJPH 2011;101:1785
Age-adjusted incidence of influenza-associated hospitalizations of adults 18+ yrs by selected ABSES measures, NH County, CT, 2005-2011 Incidence per 100,000 person-years IRV 2014:DOI:10.1111/irv.12231
Ratio of highest to lowest census tract-level poverty incidence of influenza-associated hospitalizations by year, Adults 18+ yrs, CT, 2005-2011 Incidence ratio H1N1 IRV 2014:DOI:10.1111/irv.12231
Age-adjusted incidence of influenza-associated hospitalizations of adults 18+ yrs by poverty level and race/ethnicity, NH County, CT, 2005-2011 Incidence per 100,000 person-years non-Hispanic non-Hispanic IRV 2014:DOI:10.1111/irv.12231
Foodborne bacterial pathogen age-adjusted incidence by census tract poverty level and pathogen, CT, 1999-2011 Incidence per 100,000 person-years Campylobacter Salmonella STEC
Implications of identified SES disparities and differences • Influenza – target efforts to improve vaccination rates to neighborhoods with high rates of neighborhood poverty • Bacterial foodborne pathogens – Focus prevention and prevention research efforts on high SES populations.
CSTE Data Analysis Project • In 2012-2013, 10 sites received $5000 funding each to geocode a public health dataset of their choice and analyze it using census tract poverty. • Monthly conference calls to discuss & standardize methods. • Presentations at 2013 CSTE annual conference • Sites: MA, AR, MS, NM, AZ, WA, Houston, Harris County, Multnomah County, Seattle-King County • Projects included HIV, HCV, salmonella, low birth weight, mortality (stroke, cardiac, all cause), pneumonia hospitalizations
Principles 1 • Choose cut-points to group census tract poverty levels (e.g., <5%, 5-<10%, etc.) Numerators • Assign a census tract poverty level to each “case” • N for each poverty level = sum of all the cases living in census tracts with the respective poverty level • For each poverty level’s “N”, should be able to stratify by age, sex and race-ethnicity (as possible) Denominators • Assign a census tract poverty level to each census tract • Get the denominator data for each census tract, overall and stratified by age, sex and race-ethnicity • N for each poverty level = sum of population in all census tracts with the respective poverty level
Principles 2 Calculate crude incidence/prevalence • For each poverty level, divide numerator by denominator and determine rate per unit population (e.g., per 100,000) • Can do analysis by age-specific groups, by sex, by race-ethnicity by simply sub-setting the numerator and denominator for each specific characteristic Calculate age-adjusted incidence/prevalence • May need to age-adjust if outcome incidence is age-related (e.g., mortality), since different poverty levels may have a different age structure.
Choose cut-points for poverty level • For comparability across jurisdictions, choose fixed cut-points rather than fractions (e.g., quartiles). • PHDGP recommended 4 categories: <5%, 5-<10%, 10-<20% and >20% living below federal poverty level. • NYC recently examined population structure: ~50% were in >20% group. • Decided to expand poorest group to three groups 20-<30%, 30-<40% and >40% • Does analyses by six groups, often condenses to 4 groups: <10%, 10-<20%, 20-<30%, and >30% • Bottom line: Need to know your population structure to choose groupings that will distribute your population meaningfully.
Percentage of population by census tract poverty level, NYC, 2000 & PHDGP 1990 46% Percentage of population Percent below poverty in census tract
Basic steps - numerators • Geocode outcome (case) data • Link outcome data with 2010 census tract • Access ACS data (e.g., 2007-2011) to get each census tract’s poverty level • Link each case to their census tract poverty level • Sum cases within poverty level Issues • Geocoding: how to handle institutionalized populations, esp. jails/prisons; what to do with rural areas and postal boxes where >1 census tract per ZIP; which census to geocode to (2000, 2010)? • Which source of poverty data to use: census 2000? ACS 2005-2009? 2006-2010? 2007-2011?
Basic steps - denominators • Determine how stratified you want your denominators to be: examine incidence/prevalence of outcome by age, by sex and by race-ethnicity • Access 2010 Census to get the census tract-level population data with appropriate stratifications by age, sex and/or race-ethnicity • Link census tract poverty level to each census tract • Sum populations of all census tracts in a given poverty-level grouping • including subsets of denominators by age group, sex, race-ethnicity,
Basic steps - denominators Issue • What denominators to use: Census 2000? Census 2010? Other? • Number of census tracts may change over time • No reliable inter-censal population estimates at the census tract level?
Basic steps – calculate incidence/prevalence • For each poverty level, divide numerator by denominator and determine rate per unit population (e.g., per 100,000) • Can do analysis by age-specific groups, by sex, by race-ethnicity by simply sub-setting the numerator and denominator for each specific characteristic
Incidence of Cervical Intraepithelial Neoplasia Grade 2+ by census tract poverty level, Women 20-39 years, NH County, CT, 2008-2009 Incidence per 100,000 person-years <5% 5-9.9% 10-19.9% 20+% Census tract poverty level AJPH 2012;103:156
Incidence of CIN2+ by census tract poverty and age group, Women 20-39 years, NH County, CT, 2008-2009 Incidence per 100,000 person-years AJPH 2012;103:156
Foodborne bacterial pathogen age-adjusted incidence by census tract poverty level and pathogen, CT, 1999-2011 Incidence per 100,000 person-years Campylobacter Salmonella STEC
Foodborne bacterial pathogen risk in children by census tract poverty level, CT, 1999-2011 Incidence per 100,000 person-years Age Group
Age-adjusted incidence of influenza-associated hospitalizations of adults 18+ yrs by poverty level and race/ethnicity, NH County, CT, 2005-2011 Incidence per 100,000 person-years non-Hispanic non-Hispanic IRV 2014:DOI:10.1111/irv.12231
Basic steps – age-adjust • May need to age-adjust if outcome incidence is age-related (e.g., mortality), since different poverty levels may have a different age structure. Issues • What age groups to use to adjust? • Variable: mortality – as small as 5 year age groups • Others may need less • What reference population: local jurisdiction vs US standard million?
Crude mortality rate by % of residents in census tract who live below poverty, NYC, 2000 Death Rate per 1000 Percent below poverty in census tract
Age-adjusted Mortality Rate by % in census tract who live below poverty, NYC, 2000 Death Rate per 1000 Percent below poverty in census tract
Age-adjusted Mortality Rate by % in census tract who live below poverty by race/ethnicity, NYC, 2000 Death Rate per 1000 Percent below poverty in census tract
References • PHDGP website • http://www.hsph.harvard.edu/thegeocodingproject/ • CSTE health disparities workgroup website • http://www.cste.org/group/Disparities • Guidance: http://www.cste.org/?GuidanceforStates • Updated Pdf prepared by CT EIP for CSTE • NYC Epi Research Report on standard NYC area-based poverty measure • http://www.nyc.gov/html/doh/downloads/pdf/epi/epiresearch-SES-measure.pdf • Growing number of publications
Current status of use of census tract poverty • Some jurisdictions using it regularly: e.g., WA, CT EIP, NYC • The 10 EIP sites nationally beginning to routinely geocode all data and conduct analyses, some using census tract SES • Developed standard geocoding guidance for all 10 EIP sites • Overcome obstacles to sending geocoded data to CDC • Conducting all site analyses • CSTE Health Disparities Workgroup provides an ongoing forum to encourage use of area-based poverty analyses and to discuss current analyses • CDC leading EIP workgroup and participating in CSTE Health Disparities Workgroup
Conclusions • Analysis of data using census tract poverty (CTP) is a meaningful way to describe disparities/inequities for some diseases and provides new insights relevant to control • Find disparities within race/ethnic groups • Some diseases more common among those of higher SES • Targeting groups for intervention based on SES more attractive than based solely on race/ethnicity • Can be used regardless of whether have race/ethnicity data • With use of references listed, any master’s level epidemiologist should be able to do them • CTP analyses gaining traction nationally
Thanks!Join the CSTE Health Disparities Workgroup to share analyses using census tract poverty measures / get input on issues arising when use them … and more