Download
1 / 15
160 likes | 310 Views
Safety communication at MPP3. October 2012. Some facts & figures (2011). Sales 113 billion euro Net income (loss) (1,86) billion euro Investments 6,5 billion euro Sales electricity 1.145 TWh Sales gas 1.718 TWh Households 30 million Employees 79.000.

E N D
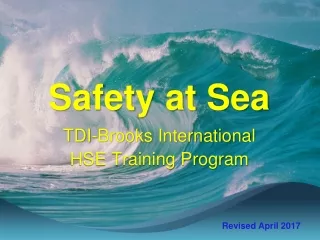
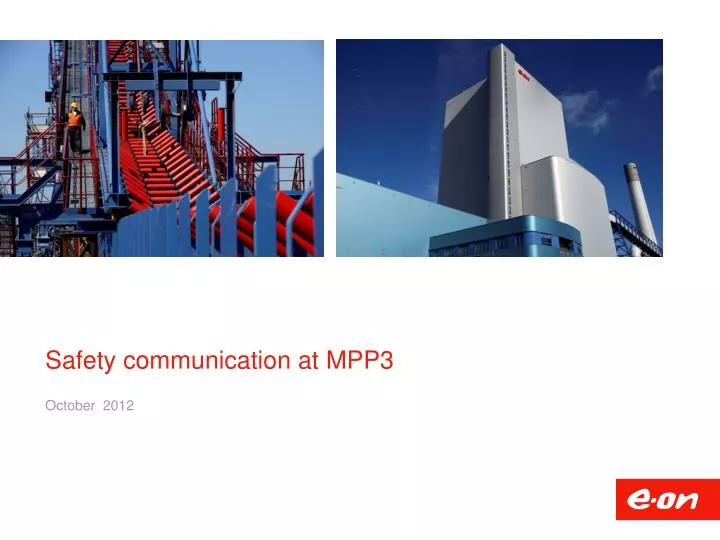
Safety communication at MPP3 October 2012
Somefacts & figures (2011) • Sales 113 billion euro • Net income (loss) (1,86) billion euro • Investments 6,5 billion euro • Sales electricity 1.145 TWh • Sales gas 1.718 TWh • Households 30 million • Employees 79.000 Europe: Focussed and synergistic positioning Outside Europe: Targeted expansion
MPP3 key data Start construction April 2008 In operation End 2013 Workers on site Approx. 1,800 Nationalities 25-30 Contractor firms 800 HPE inductions 4,500 LTIFR 0 TRIF 4.8 Record safe hours 5,300,000
Safety support on highest level “I am dedicated to the safety and health of our employees and those that work with and for us. With respect to topics of occupational safety, I expect pragmatic and stringent leadership from the HSE Council. But one thing is clear: Only if everyone chips in -every day- will implementation work.” Klaus-Dieter Maubach (Member Management Board E.ON AG, Head of the HSE Council)
Technology and standards HSE Management Systems HSE Performance over time • Behaviour • Visible leadership / personal accountability • Shared purpose & belief • Aligned performance commitment & external view • HSE delivers business value • Engineering improvements • Hardware improvements • Safety emphasis • E&H Compliance Incident rate • Integrated HSE-MS • Reporting • Assurance • Competence • Risk Management Improved culture Time
Culture Ladder GENERATIVE HSE is how we do business round here PROACTIVE we work on the problems that we still find Increasingly informed CALCULATIVE we have systems in place to manage all hazards REACTIVE Safety is important, we do a lot every time we have an accident Increasing Trust/Accountability PATHOLOGICAL who cares as long as we’re not caught
Culture Ladder • chronic unease • safety seen as a profit centre • new ideas are welcomed GENERATIVE • resources are available to fix things before an accident • management is open but still obsessed with statistics • procedures are “owned” by the workforce PROACTIVE • we cracked it! • lots and lots of audits • HSE advisers chasing statistics CALCULATIVE • we are serious, but why don’t they do what they’re told? • endless discussions to re-classify accidents • You have to consider the condition under which we are working REACTIVE PATHOLOGICAL • the lawyers/regulator said it was OK • of course we have accidents, it’s a dangerous business • sack the idiot who had the accident
Focus on Safety • Why: up to 1,800 workers on site • How: • Culture change • Example behavior and leadership • 90% of incidents due human error • Control of primary process • Control of quality and logistics • No changes = no rush jobs • FEL / preparation is 90% of success As part of the primary process Real involvement (certificates, observation rounds, …)
Prof. JopGroeneweg (Leiden University) “An excellent primary process makes a safety department unnecessary.”
Aris Blankenspoor (E.ON) “An excellent primary process starts with Front End Loading.”
Cost of change is low value (% of overall commitment) Front End Loading (FEL) 2 1 FEL Implementative 1 2 • Cost of change is high value (% of overall commitment) 11
The FEL Project system translates business objectives into project development Optimal definition of the primary construction process Continuous improvement and use of “best practices” To maintain business objective during project execution Fulfil business demands effective and efficient Tools with proven and benchmarked results are used to optimize the primary process An optimized primary process leads to good preparation and zero change Zero change leads to high safety performance and reduced investment costs! Optimize project results 12
Safety Communication Tools (1) Site wide Communication Dept. • Safety Summit • Contractor Safety Platform (Award) • Safety Magazine • Safety induction gate • Poster/flyer campaigns • Digital screens/billboards • Celebration milestones (BBQ, gate, …) • Positive recognition (lottery) • Safety alerts - meetings • Kick off meetings • Risk sessions • Biweekly HSE Coordination meetings • Status meetings • Area coordination meetings • Subject coordination meetings • 4-weeks look ahead • - Daily/weekly/toolbox meetings • Permit to work process • Safety observation rounds Contractor firms Construction mgt./Safety Dept. (Groups of) individuals Construction mgt./Safety Dept.
Safety Communication Tools (2) All staff, including secretaries: VCA-VOL PMT: NEBOSH Safety staff: Influencing General: behaviour, respect
90% of project success (including safety) is determined by good preparation Each change is a potential risk 15