Download
1 / 15
170 likes | 255 Views
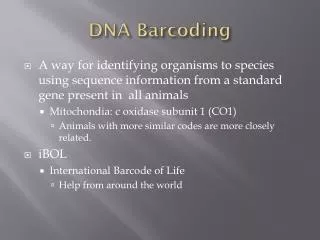
Learn how DNA sequence data is obtained using samples like blood, saliva, and feathers. Compare DNA sequences and use bioinformatics tools like BLAST for analysis. Understand DNA peaks, quality values, and reading frames for genetic research insights.

E N D
LESSON 9: Analyzing DNA Sequences and DNA Barcoding PowerPoint slides to accompany Using Bioinformatics: Genetic Research
How DNA Sequence Data is Obtained for Genetic Research Obtain Samples: Blood , Saliva, Hair Follicles, Feathers, Scales Genetic Data Compare DNA Sequences to One Another Extract DNA from Cells …TTCACCAACAGGCCCACA… Sequence DNA TTCAACAACAGGCCCAC TTCACCAACAGGCCCAC TTCATCAACAGGCCCAC • GOALS: • Identify the organism from which the DNA was obtained. • Compare DNA sequences to each other. Image Source: Wikimedia Commons
Overview of DNA Sequencing Mix with primers Perform sequencing reaction DNA Sample …T T C A C C A A C T G G C C C A C A… DNA Sequence Chromatogram
Sequence Both Strands of DNA Sequence #1: Top Strand AT G AC G GATCA G C Sequence #2: Bottom Strand Sequence #1: Top Strand T A CTGC CT A GTCG Sequence #2: Bottom Strand Image Source: Wikimedia Commons
Compare the Two Sequences Sequence #1: Top Strand Sequence #1: Top (“F”) Sequence #2: Bottom Strand 5’- AT G AC G G ATCA G C – 3’ Sequence #2: Bottom (“R”) 3’- T A CTGC C T A GTCG – 5’ Bioinformatics tools like BLAST can be used to compare the sequences from the two strands. Image Source: Wikimedia Commons
Viewing DNA Sequences with FinchTV Image Source: FinchTV
DNA Peaks Can Vary in Height and Width Image Source: FinchTV
Quality Values Represent the Accuracy of Each Base Call Quality values represent the ability of the DNA sequencing software to identify the base at a given position. Quality Value (Q) = log10 of the error probability * -10. Q10 means the base has a one in ten chance (probability) of being misidentified. Q20 = probability of 1 in 100 of being misidentified. Q30 = probability of 1 in 1,000 of being misidentified. Q40 = probability of 1 in 10,000 of being misidentified.
Quality Values Are Used When Comparing Sequences Quality values represent the ability of the DNA sequencing software to identify the base at a given position. Image Source: FinchTV
Background “Noise” May Be Present Image Source: FinchTV
The Beginning and Ends of Sequences Are Likely To Be Poor Quality Image Source: FinchTV
Examples of Chromatogram Data #1 #2 #3 Circle #1:Example of a series of the same nucleotide (many T’s in a row). Notice the highest peaks are visible at each position. Circle #2: Example of an ambiguous base call. Notice the T (Red)at position 57 (highlighted in blue) is just below a green peak (A) at the same position. Look at the poor quality score on bottom left of screen (Q12). AnAmay be the actual nucleotide at this position. Circle #3: Example of two A’s together. The peaks look different, but are the highest peaks at these positions. Image Source: FinchTV
Transcription and Translation Begin at the Start Codon Reading Frame +1 M T D Q 5’- AT G AC G G ATGA G C – 3’ Sequence #1: 3’- T A CTGC CT A CTCG – 5’ Sequence #2:
There Are Six Potential Reading Frames in DNA Reading Frame +3 Reading Frame +2 Reading Frame +1 M T D Q 5’- AT G AC G G ATGA G C – 3’ Sequence #1: 3’- T A CTGC CT A CTCG – 5’ Sequence #2: Reading Frame -1 Reading Frame -2 Reading Frame -3
Frame-Shifts, Amino Acid Changes, and Stop Codons M D G STOP Reading Frame +2 5’- AT G G AC G G ATGA G– 3’ Accidental insertion of an extra “G” when editing Reading Frame +1 M T G E 5’- AT G AC G G ATGA G C – 3’ Sequence #1: 3’- T A CTGC CT A CTCG – 5’ Sequence #2: