Download
1 / 15
150 likes | 174 Views
Explore grades, rankings, participation, and highlights of Mumbai Municipal Councillors based on RTI data. Top 10 and bottom 10 councillors identified by rank and movement. Dive into discussion participation and key statistics for 2014-15. FIR details included.

E N D
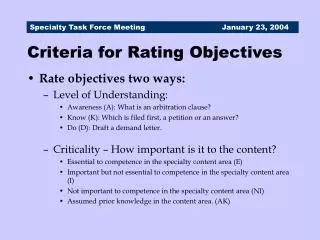
Parameters for Rating Municipal Councillors RTI Data Source: 1 Municipal Secretary, MCGM (MCGM Head Office and BEST) and Assistant Engineer (Maintenance), MCGM (from all the 24 Administrative Wards of MCGM); 2 Election Commission Department, MCGM; 3 Mumbai Police. 4Area Development Fund relates to the period April’14 to March’15 (Rs.60 lakhs).
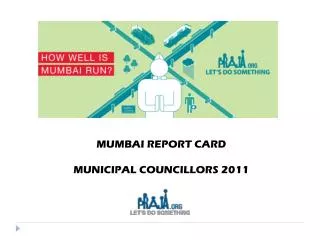
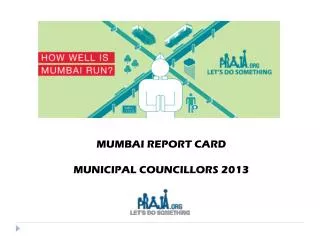
Mumbai Report CardMunicipal Councillors 2015 Grade A – Between 100% to 80% Grade B – Less than 80% to 70% Grade C – Less than 70% to 60% Grade D – Less than 60% to 50% Grade E – Less than 50% to 35% Grade F – Less than 35% (Period under consideration – April 2014 to March 2015. Ranking of 220 councillors)
Highlights (1/2) • For the first time ‘A’ grade has been assigned to a councillor • Average committee meeting attendance down to 68% in 2014-15 from 81% in 2012-13 • Proportion of questions asked compared to civic complaint's just 29.1%. • Awareness and accessibility scores have increased from 35% in 2013-14 to 52% in 2014-15 • 58% have asked less than 10 questions in 2014-15
Highlights (2/2) 9 Councillors haven’t asked a single question this year (FY 2014-15)
FIRs registered against counicllors as of 31st December 2014 • Total of current municipal councillors who have FIRs registered: 57 • Councillors with most FIRs: Raju Shripad Pednekar(12), Anant Bhiku Nar(11) and Ramesh Gajanan Korgaonkar(8)
Committee wise data Note: (*) Only those who were present form April 2014 to March 2015 have been taken, also former Mayor and current Mayor have been excluded