Download
1 / 92
920 likes | 935 Views
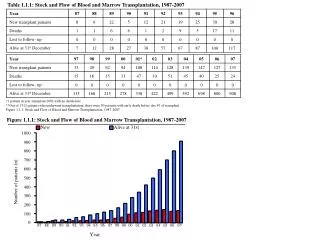
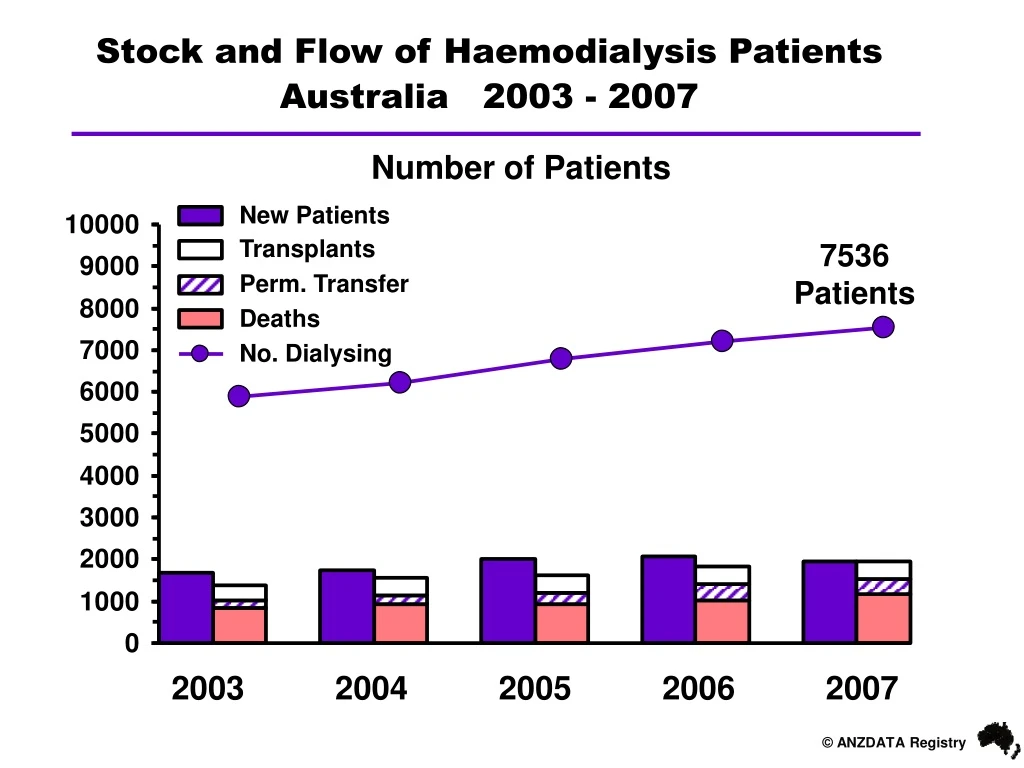
Stock and Flow of Haemodialysis Patients Australia 2003 - 2007. Number of Patients. New Patients Transplants Perm. Transfer Deaths No. Dialysing. 7536 Patients. 2003 2004 2005 2006 2007.

E N D
Stock and Flow of Haemodialysis PatientsAustralia 2003 - 2007 Number of Patients New Patients Transplants Perm. Transfer Deaths No. Dialysing 7536 Patients 2003 2004 2005 2006 2007
Stock and Flow of Haemodialysis PatientsNew Zealand 2003 - 2007 Number of Patients 1323 Patients New Patients Transplants Perm. Transfer Deaths No. Dialysing 2003 2004 2005 2006 2007
Age of New Haemodialysis Patients 2007 Australia No. Pats. 9 45 94 184 303 418 479 385 47
Age of Current Haemodialysis Patients Australia 31-Dec-2007 No. Pats. 5 98 305 731 1201 1595 1804 1582 215
Age of New Haemodialysis Patients 2007 New Zealand No. Pats. 3 20 16 45 63 95 89 38 4
Age of Current Haemodialysis Patients New Zealand31-Dec-2007 No. Pats. 3 38 79 162 261 360 299 108 13
Distribution of Blood Flow Rates Number of Patients Australia
Distribution of Blood Flow Rates Number of Patients New Zealand
Haemodialysis Frequency (Per Week) December 2005 - 2007 Australia New Zealand
Haemodialysis Session Length (Hours) December 2005 - 2007 Australia New Zealand
Haemodialysis Duration (Hours per Week) December 2005 - 2007 Australia New Zealand
Percentage of Patients Dialysing Five or More Days per Week Australia New Zealand 3 2.5 2 1.5 Percent 1 .5 0 Sep 02 Sep 03 Dec 04 Dec 06 Sep 02 Sep 03 Dec 04 Dec 06 Mar 03 Mar 04 Dec 05 Dec 07 Mar 03 Mar 04 Dec 05 Dec 07 Survey Period
Percentage of Patients Dialysing Three Days per Week Dialysing 4.5 Hours per Session or Longer Australia New Zealand 65 60 55 Percent 50 45 Sep 02 Sep 03 Dec 04 Dec 06 Sep 02 Sep 03 Dec 04 Dec 06 Mar 03 Mar 04 Dec 05 Dec 07 Mar 03 Mar 04 Dec 05 Dec 07 Survey Period
Percentage of Patients Dialysing >12 Hours per Week Australia New Zealand 65 60 55 Percent 50 45 Sep 02 Sep 03 Dec 04 Dec 06 Sep 02 Sep 03 Dec 04 Dec 06 Mar 03 Mar 04 Dec 05 Dec 07 Mar 03 Mar 04 Dec 05 Dec 07 Survey Period
Patient Survival - Haemodialysis at 90 Days Censored for Transplant - Australia 1.00 0.90 0.80 Patient Survival 0.70 0.60 1997-1999 (2726) 2000-2002 (3220) 0.50 2003-2005 (3821) 2006-2007 (2975) 0.40 0 1 2 3 4 5 Years
1.00 0.90 0.80 Patient Survival 0.70 0.60 0.50 0.40 0 1 2 3 4 5 Years Patient Survival - Haemodialysis at 90 Days Censored for Transplant - New Zealand 1997-1999 (352) 2000-2002 (582) 2003-2005 (666) 2006-2007 (500)
Patient Survival - Haemodialysis at 90 Days Censored for Transplant - Australia 1.00 0.90 0.80 0.70 Patient Survival 0.60 0.50 0.40 Non-diabetic (9279) 0.30 Diabetic (3463) 0.20 0 1 2 3 4 5 Years
Patient Survival - Haemodialysis at 90 Days Censored for Transplant - New Zealand 1.00 0.90 0.80 0.70 Patient Survival 0.60 0.50 0.40 Non-diabetic (1227) 0.30 Diabetic (873) 0.20 0 1 2 3 4 5 Years
Patient Survival - Haemodialysis at 90 Days Censored for Transplant - Australia 1.00 0.80 0.60 Patient Survival 0.40 <40 (1582) 40-59 (4162) 0.20 60-74 (4592) >=75 (2406) 0.00 0 1 2 3 4 5 Years
Patient Survival - Haemodialysis at 90 Days Censored for Transplant - New Zealand 1.00 0.80 0.60 Patient Survival 0.40 <40 (343) 40-59 (914) 0.20 60-74 (693) >=75 (150) 0.00 0 1 2 3 4 5 Years
Patient Survival - Haemodialysis at 90 Days Censored for Transplant - Australia 1.00 Adjusted for Age, Diabetic PRD, Race, Gender and Comorbid Conditions 0.90 0.80 Patient Survival 0.70 0.60 1997-1999 (2726) 2000-2002 (3220) 0.50 2003-2005 (3821) 2006-2007 (2975) 0.40 0 1 2 3 4 5 Years
Patient Survival - Haemodialysis at 90 Days Censored for Transplant - New Zealand 1.00 Adjusted for Age, Diabetic PRD, Race, Gender and Comorbid Conditions 0.90 0.80 Patient Survival 0.70 0.60 1997-1999 (352) 2000-2002 (582) 0.50 2003-2005 (666) 2006-2007 (500) 0.40 0 1 2 3 4 5 Years
Haemodialysis Surface Area Australia Number of Patients 13 103 203 1295 1 4 1423 1950 213 6 1105 115 729 8 100 130 1222 0 0 1348 2324 135 4 1494 117 652
Haemodialysis Surface Area New Zealand Number of Patients 3 28 20 3 0 0 192 455 1 2 294 1 208 4 14 22 3 0 0 173 454 0 1 525 0 227
Mean Haemoglobin Among Dialysis Patients Australia New Zealand 120 115 110 Mean Hb(g/L) 105 100 Sep 02 Sep 03 Dec 04 Dec 06 Sep 02 Sep 03 Dec 04 Dec 06 Mar 03 Mar 04 Dec 05 Dec 07 Mar 03 Mar 04 Dec 05 Dec 07 Survey Period PD HD By Survey Period
Australia 100 90 80 70 60 50 40 30 Sep 02 Sep 03 Dec 04 Dec 06 Sep 02 Sep 03 Dec 04 Dec 06 Mar 03 Mar 04 Dec 05 Dec 07 Mar 03 Mar 04 Dec 05 Dec 07 Use of Erythropoietic Agents By Survey Period New Zealand Percent Survey Period PD HD
Haemoglobin - Australia December 2005-2007 100 4 7 7 8 9 10 Hb (g/L) 10 11 14 16 15 15 80 23 140+ 21 26 23 25 26 60 130-139 Percent 28 27 120-129 25 26 40 25 21 110-119 20 35 34 28 28 27 26 <110 0 2005 2006 2007 2005 2006 2007 PD HD
Haemoglobin – New Zealand December 2005-2007 100 4 4 6 6 6 6 Hb (g/L) 9 10 11 12 12 13 80 19 22 140+ 20 21 22 21 60 130-139 Percent 31 25 22 25 23 25 120-129 40 110-119 39 39 20 38 37 36 34 <110 0 2005 2006 2007 2005 2006 2007 PD HD
Haemoglobin - Australia By Coronary Artery Disease Status December2005-2007 100 35 35 80 Hb (g/L) 43 44 46 46 >120 60 Percent 30 31 110-120 29 28 27 27 40 <110 20 35 34 28 27 27 27 0 2005 2006 2007 2005 2006 2007 No CAD CAD
Haemoglobin – New Zealand By Coronary Artery Disease Status December2005-2007 100 32 33 35 36 36 40 80 Hb (g/L) >120 60 Percent 28 23 32 26 28 26 110-120 40 <110 41 40 38 20 36 36 33 0 2005 2006 2007 2005 2006 2007 No CAD CAD
Haemoglobin in Haemodialysis Patients Australia 31 December 2007 140 130 120 Median Hb (g/L) 110 100 Excludes hospitals with <10 patients 90 0 5 10 15 20 25 30 35 40 45 50 55 60 Caring Hospital
Haemoglobin in Haemodialysis Patients New Zealand 31 December 2007 140 130 120 Median Hb (g/L) 110 100 Excludes hospitals with <10 patients 90 0 1 2 3 4 5 6 7 8 9 Caring Hospital
% Haemodialysis Patients with Hb 110-129 g/L Australia 31 December 2007 100 90 80 70 60 Percent 50 40 30 20 10 Excludes hospitals with <10 patients 0 0 5 10 15 20 25 30 35 40 45 50 55 60 Caring Hospital
% Haemodialysis Patients with Hb 110-129 g/L New Zealand 31 December 2007 100 90 80 70 60 Percent 50 40 30 20 10 Excludes hospitals with <10 patients 0 0 1 2 3 4 5 6 7 8 9 Caring Hospital
Haemoglobin in Peritoneal Dialysis Patients Australia 31 December 2007 140 130 120 Median Hb (g/L) 110 100 Excludes hospitals with <10 patients 90 0 5 10 15 20 25 30 35 Caring Hospital
Haemoglobin in Peritoneal Dialysis Patients New Zealand 31 December 2007 140 130 120 Median Hb (g/L) 110 100 Excludes hospitals with <10 patients 90 0 1 2 3 4 5 6 7 8 9 10 Caring Hospital
100 90 80 70 60 Percent 50 40 30 20 10 Excludes hospitals with <10 patients 0 0 5 10 15 20 25 30 % Peritoneal Dialysis Patients with Hb 110-129 g/L Australia 31 December 2007 35 Caring Hospital
% Peritoneal Dialysis Patients with Hb 110-129 g/L New Zealand 31 December 2007 100 90 80 70 60 Percent 50 40 30 20 10 Excludes hospitals with <10 patients 0 0 1 2 3 4 5 6 7 8 9 10 Caring Hospital
Ferritin - Australia December 2005-2007 100 11 14 15 15 mcg/L 17 18 16 80 19 18 800+ 23 21 23 60 500-799 39 Percent 35 37 38 200-499 38 38 40 100-199 19 16 18 20 12 12 11 <100 16 15 13 12 11 11 0 2005 2006 2007 2005 2006 2007 PD HD
Ferritin - New Zealand December 2005-2007 100 10 11 12 15 15 mcg/L 20 14 18 80 18 21 800+ 22 22 60 500-799 42 Percent 40 39 36 36 31 200-499 40 100-199 17 18 21 12 15 14 20 <100 15 14 14 13 13 12 0 2005 2006 2007 2005 2006 2007 PD HD
Transferrin Saturation - Australia December 2005-2007 100 12 13 13 14 14 15 Tsat (%) 80 20 20 21 19 20 19 40+ 60 Percent 30-39 38 37 41 38 39 41 40 20-29 <20 20 30 29 29 27 27 26 0 2005 2006 2007 2005 2006 2007 PD HD
Transferrin Saturation - New Zealand December 2005-2007 100 13 13 14 15 15 16 Tsat (%) 80 21 22 19 19 22 19 40+ 60 Percent 30-39 33 36 37 38 39 38 40 20-29 <20 20 33 30 29 26 26 26 0 2005 2006 2007 2005 2006 2007 PD HD
% Haemodialysis Patients with Ferritin 200-500 mcg/L Australia 31 December 2007 100 90 80 70 60 Percent 50 40 30 20 10 Excludes hospitals with <10 patients 0 0 5 10 15 20 25 30 35 40 45 50 55 60 Caring Hospital
% Haemodialysis Patients with Ferritin 200-500 mcg/L New Zealand 31 December 2007 100 90 80 70 60 Percent 50 40 30 20 10 Excludes hospitals with <10 patients 0 0 1 2 3 4 5 6 7 8 9 Caring Hospital
% Peritoneal Dialysis Patients with Ferritin 200-500 mcg/L Australia 31 December 2007 100 90 80 70 60 Percent 50 40 30 20 10 Excludes hospitals with <10 patients 0 0 5 10 15 20 25 30 35 Caring Hospital
% Peritoneal Dialysis Patients with Ferritin 200-500 mcg/L New Zealand 31 December 2007 100 90 80 70 60 Percent 50 40 30 20 10 Excludes hospitals with <10 patients 0 0 1 2 3 4 5 6 7 8 9 10 Caring Hospital
% Haemodialysis Patients with TSat >20% Australia 31 December 2007 100 90 80 70 60 Percent 50 40 30 20 10 Excludes hospitals with <10 patients 0 0 5 10 15 20 25 30 35 40 45 50 55 60 Caring Hospital
% Haemodialysis Patients with TSat >20% New Zealand 31 December 2007 100 90 80 70 60 Percent 50 40 30 20 10 Excludes hospitals with <10 patients 0 0 1 2 3 4 5 6 7 8 9 Caring Hospital
% Peritoneal Dialysis Patients with TSat >20% Australia 31 December 2007 100 90 80 70 60 Percent 50 40 30 20 10 Excludes hospitals with <10 patients 0 0 5 10 15 20 25 30 35 Caring Hospital
% Peritoneal Dialysis Patients with TSat >20% New Zealand 31 December 2007 100 90 80 70 60 Percent 50 40 30 20 10 Excludes hospitals with <10 patients 0 0 1 2 3 4 5 6 7 8 9 10 Caring Hospital