Download
1 / 20
200 likes | 277 Views
Overview. Probabilities Probability Distribution Predictor Variables Prior Information New Data Prior and New Data. Medieval Times: Dice and Gambling. Modern Times: Dice and Games/ Gambing. Dice Probabilities. 1 6. Dice Outcome are Independent. =. 16.7%. Sum. 6 3 6. =. 16.78%.

E N D
Overview • Probabilities • Probability Distribution • Predictor Variables • Prior Information • New Data • Prior and New Data
Dice Probabilities 1 6 Dice Outcome are Independent = 16.7% Sum 6 36 = 16.78% 1 36 = 2.78%
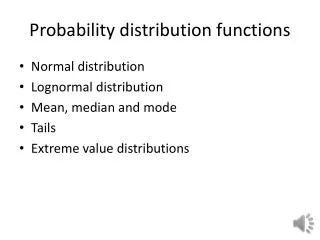
Dice Probabilities Probability Distribution
1600’s: Probability& Gambling Blaise Pascal Do these have equal probabilities? Chevalier de Méré one "6" in four rolls one double-six in 24 throws
Prediction Model: Dice ? Y = 1 6 = 16.7% No Predictor Variables
Prediction Model: Heights Linear Regression invented in 1877 by Francis Galton ChildHeight FatherHeight + MotherHeight + Gender + Ɛ = Predictor Variables!!!
Prediction Model: Logistic Logistic Regression invented in 1838 by Pierre-Francois Verhulst
Probability & Classification: Gender ~ Height Let’s Invert the Problem – “Given Child Height What is the Gender?” and Pretend its 1761 – Before Logistic Regression Gender (Categorical) (Continuous) ChildHeight
1761: Bayesian Child Height Gender = Probability Female Probability Distribution Height of the Person Probability Male New Data = 67.5 75 66.5 60 Prior (X) Data Prior (X) Data Prior (X) Prior (X)
Bayesian Formulas 0.49 0.51 Same for both female and male
Normal Distribution and Probability 2.6 69.2 65.5 61.3 D D
Bayesian Formulas D D 60 5.549099 66.5 D 6.884877 67.5 75
Naïve Bayes 84.1%